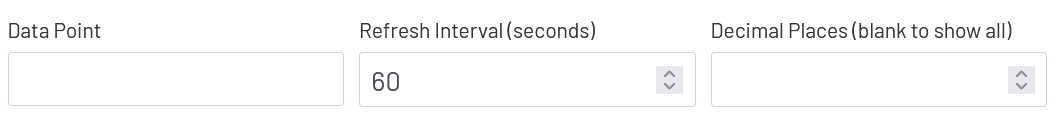
Data Points values can be displayed directly on a diagram, or as a filter value or data source for other shapes. In either case, configuring the Data Point usage is the same. Depending on the Data Point type, the Filter Config section below may or may not be used, but these 3 values are always required:
- Data Point: This is the name of the Data Point you want to show the value of. This field is a combo box, so clicking twice will show a dropdown list of the available Data Points, or you can simply start typing to see a filtered list of names.
- Refresh Interval: Sets how frequently the diagram will try to fetch the latest value of the selected Data Point. Note that tag-based Data Points are always fetched on 1-second intervals, Mongoose-based Data Points cannot be fetched more frequently than every 5 seconds, and SQL-based Data Points must be at least every 10 seconds.
- Decimal Places: For numeric values, it is not always preferable to show the value to the full level of precision. It will rarely be important for an operator to know that a value is exactly 37.8427144109. Setting a number of decimal places to truncate the value to in this field will trim that to a value like 37.842. Note that this is a simple truncation - no rounding is done.
Filter Config
SQL-based and Mongoose-based Data Points sometimes require filter inputs when fetching the latest value. If the Data Point being used by this shape (or used as a filter or data source in another shape) requires filter input, the config form will show a row for setting the source of each filter value:
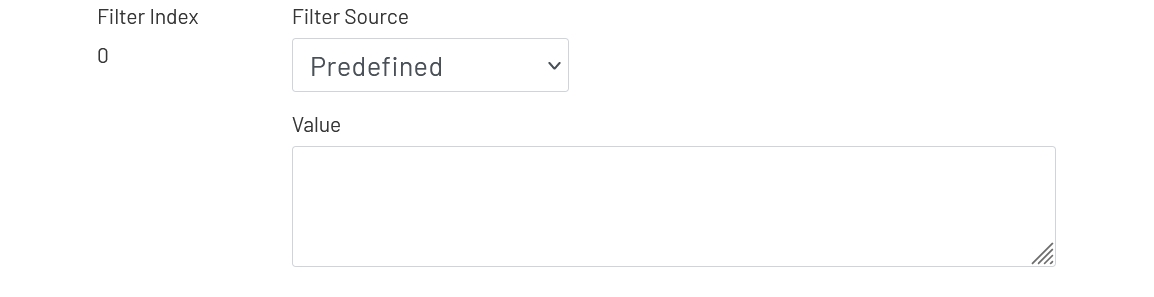
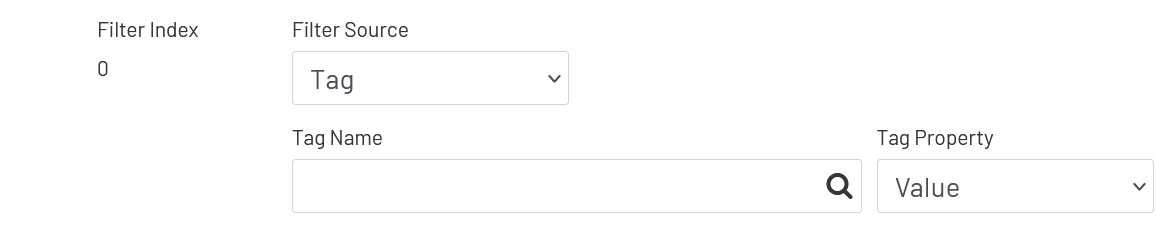
- Filter Index: Filter values are substituted in SQL queries and Mongoose calls in the order they're specified in the Data Point setup. The index here is simply to show that (zero-indexed) order to make sure you choose the right sources for each filter.
- Filter Source: This determines where the value for the filter will come from. The form will vary depending on the source chosen.
Predefined
- Value: This exact hard-coded value will be used every time this Data Point value is fetched.
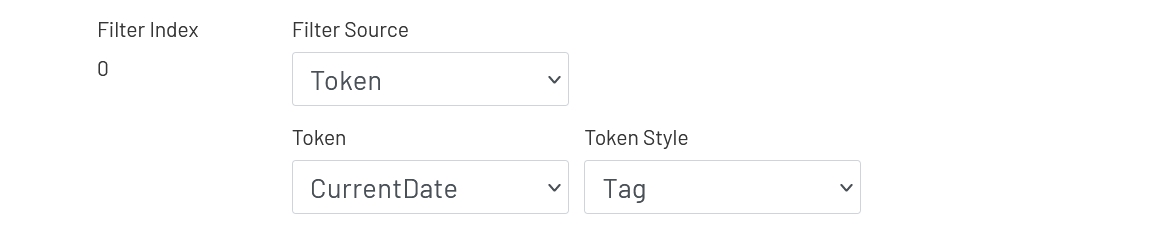
Token
- Token: If a date/time value is needed for this filter input, a token can be used. The value is generated fresh each time a Data Point value is requested, so it will be accurate to within a few milliseconds.
- Token Style: Mongoose and the Data Acquisition Engine expect date/time values in different formats. Choose the correct style here based on the filter or data source this Data Point is being used for.
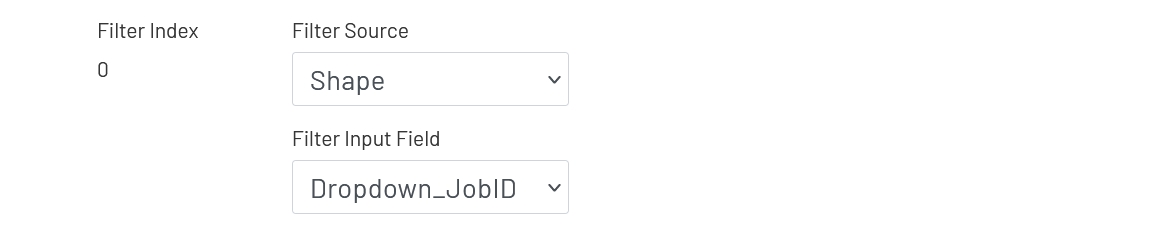
Shape
- Filter Input Field: Choose another shape on the diagram from this dropdown. When a new Data Point value is being fetched, the value of that shape at that time will be used for the filter value.
Tag
- Tag Name: Click the magnifying glass icon to open a modal window to choose a tag. When a new Data Point value is being fetched, the live value of the tag property chosen below will be used for the filter value.
- Tag Property: This is the name of the tag property you are using for the filter value, usually 'Value'. Note that some of the properties in this dropdown depend on features being enabled on that tag. For example, choosing to fetch an alarm limit value will not work if that alarm limit isn't enabled on the tag.
Troubleshooting
Why am I not getting the most recent values from a Data Point source?
Check the caching settings for the Data Point. If it is being cached, the value will only be updated every X minutes, as configured on that Data Point.
Why is my Data Point value flashing in my diagram?
If a Data Point value requested by a diagram cannot be retrieved for an 'expected' reason (for example, that Data Point was deleted after the diagram was configured), an empty value will be displayed. If the error is eventually resolved, the value will start displaying again. 'Unexpected' errors (such as an error from Mongoose due to invalid filter values) are handled differently. If no value was displaying before, the diagram will continue to show an empty value. If the Data Point had been working and then starts to return an error, the previous value displayed in the diagram will be marked as 'bad quality' so the text will turn red and start flashing.