One of the most valuable uses for diagrams is creating HMIs and Operator Interfaces, which can be displayed near machines for operators to interact with. These can be used to display realtime machine data from tags or information from CSI through Mongoose IDO calls, or to push data back into either of those systems. These interfaces may be as simple as a few shapes to display live machine data, or complex enough to control whole lines. Here we'll go over some of the elements of a fake HMI to give examples of what can be done:
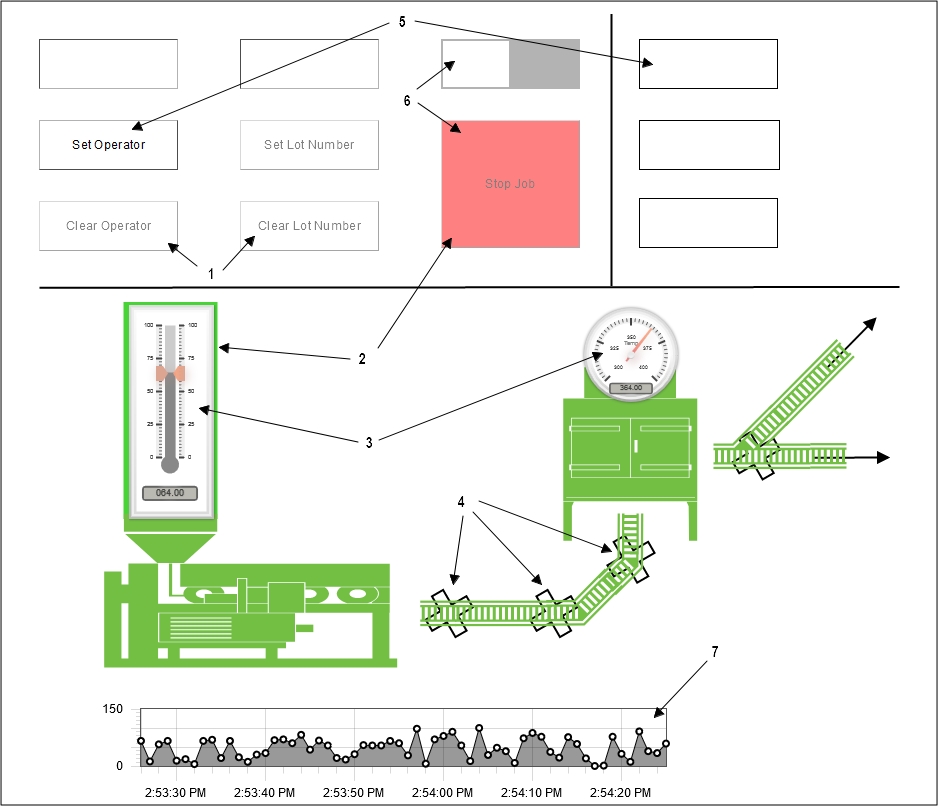
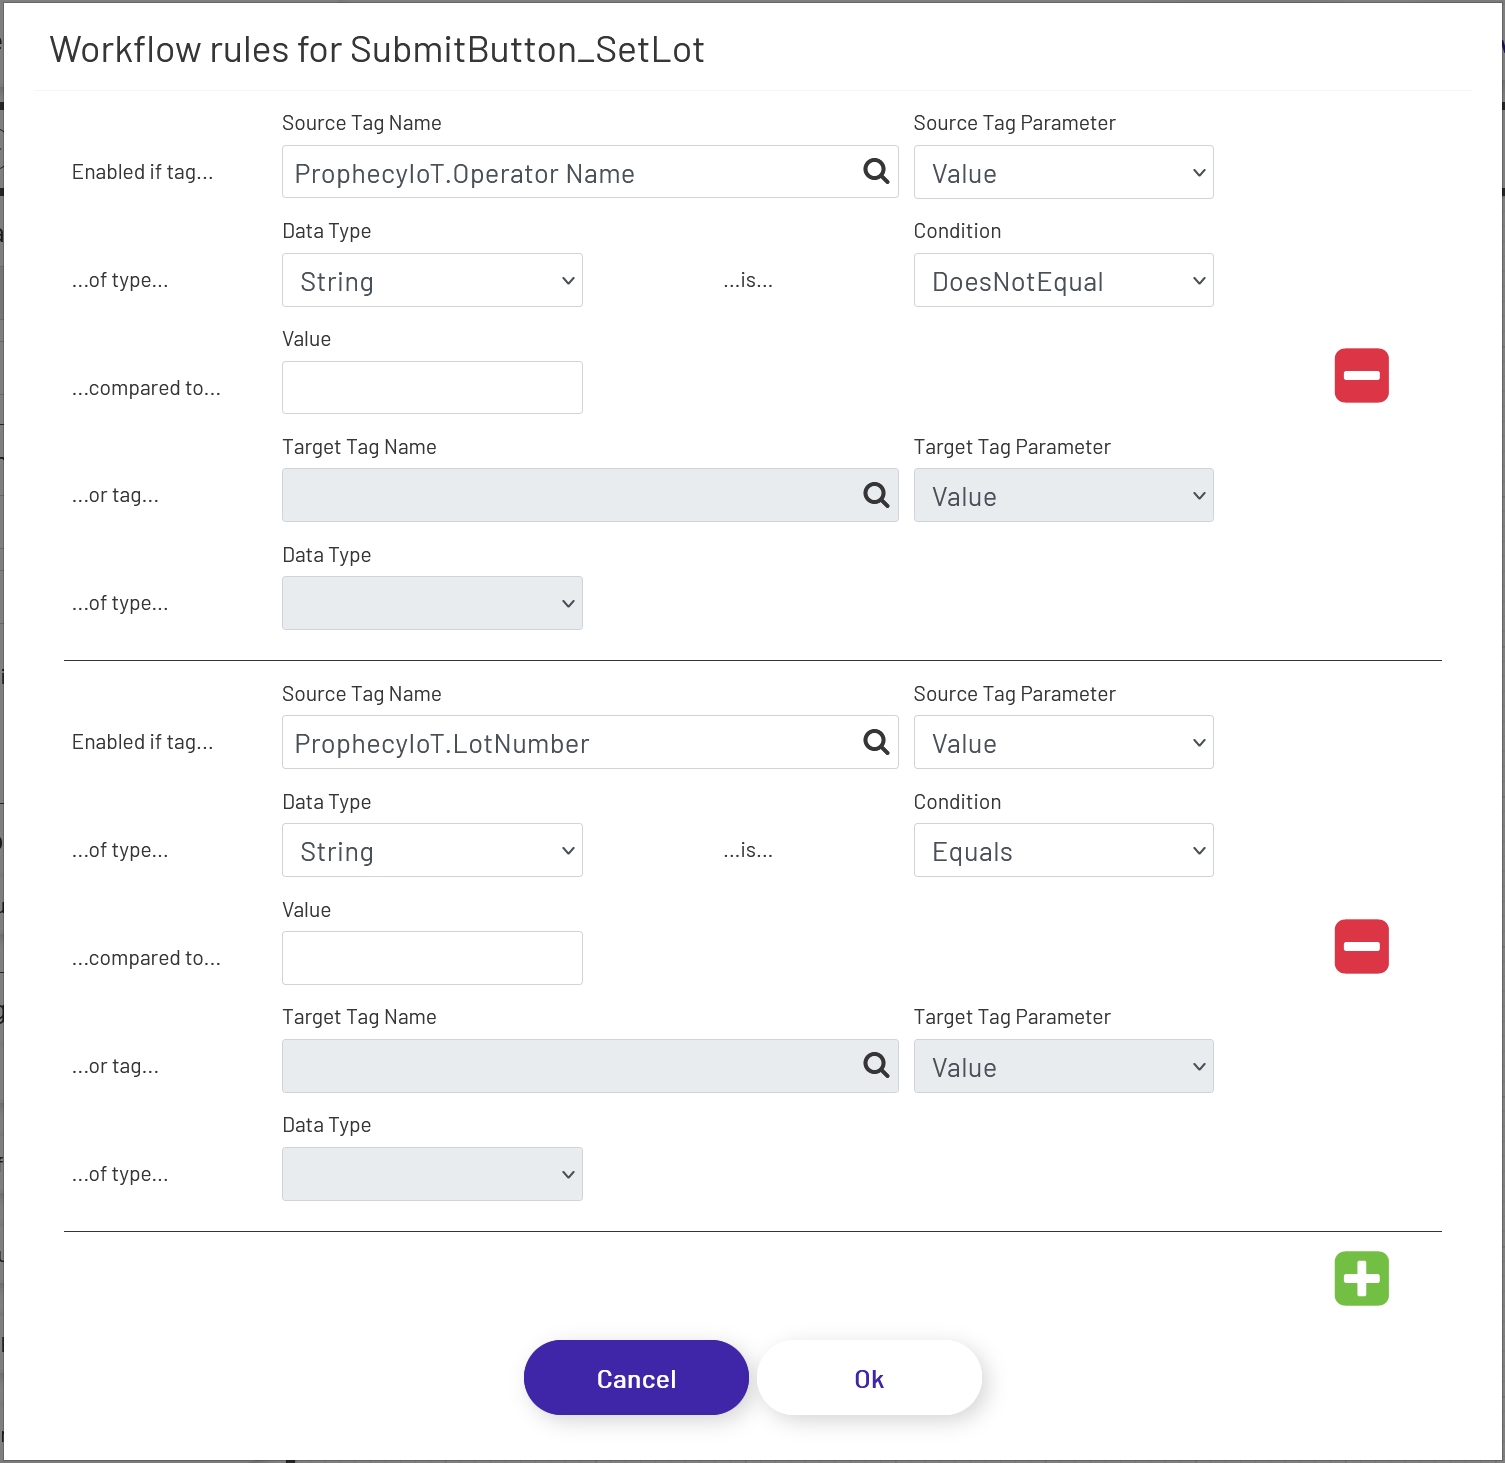
1 - The first thing to notice is that most of the shapes at the top are 'greyed-out', or disabled. That is because workflow rules have been set up to enable and disable those shapes according to tag values. For example, the 'Set Lot Number' button is only enabled if an employee name has been specified, but a lot number hasn't yet. By chaining rules like that together, diagram designers can force operators to proceed through the required steps in the desired order.
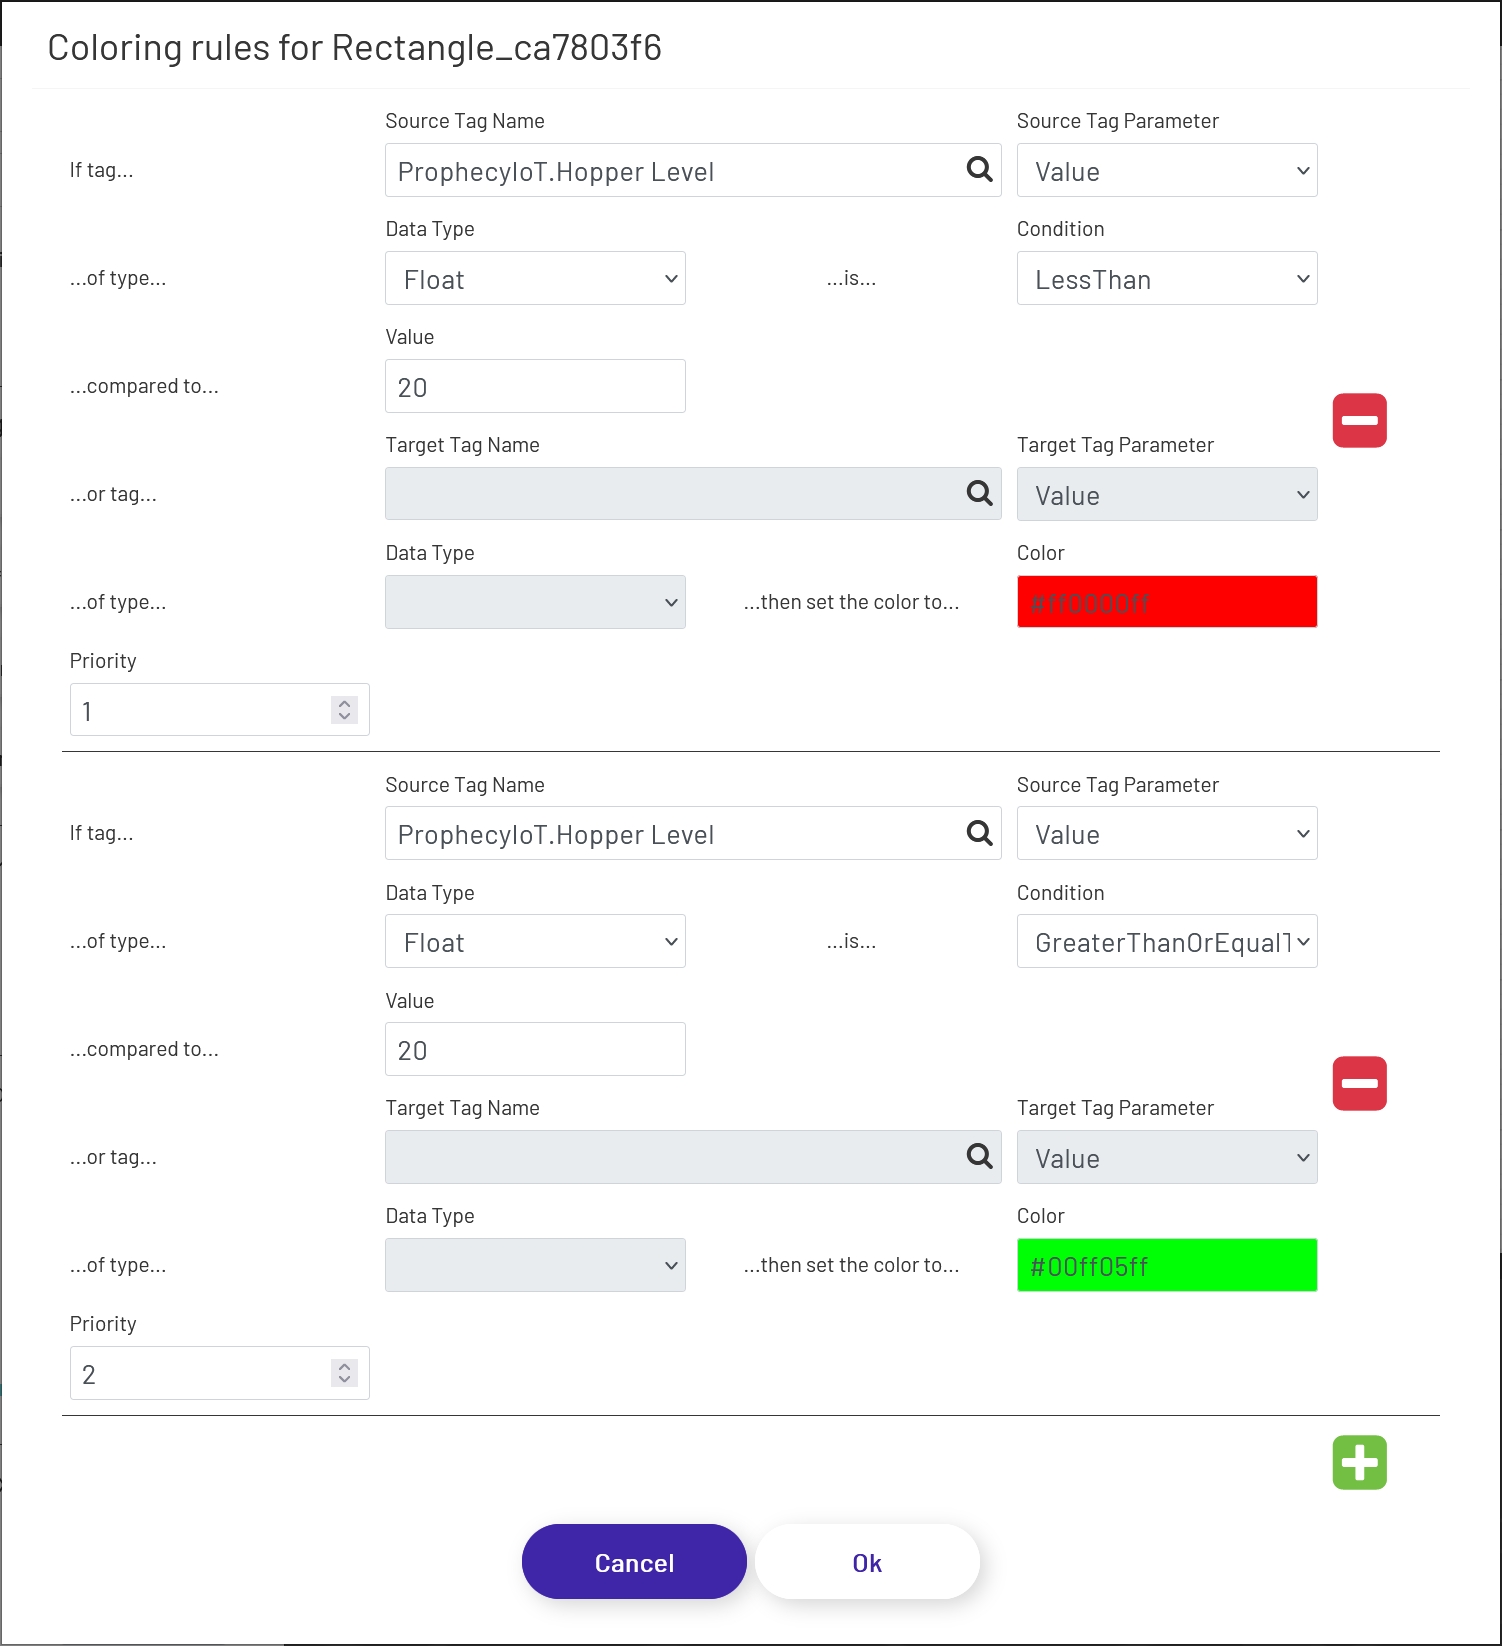
2 - Next, note that some of the shapes are different colors. If you could see this diagram in operation, those shapes (and others) would actually change colors dynamically as tag values did. That's because coloring rules have been set up to do so. Like the workflow rules, they can be used to indicate state. For example, the big red button will turn green if a lot number has been provided, and the hopper background color changes depending on the level:
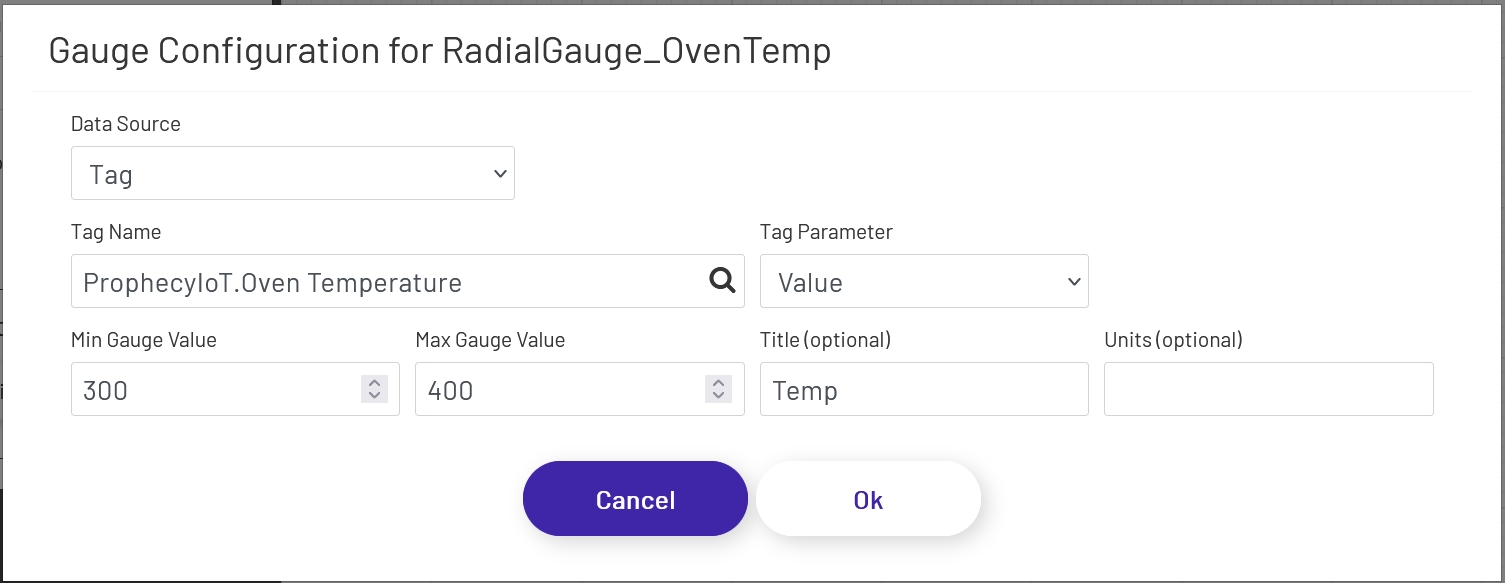
3 - Gauge shapes show realtime machine values in easy-to-read formats:
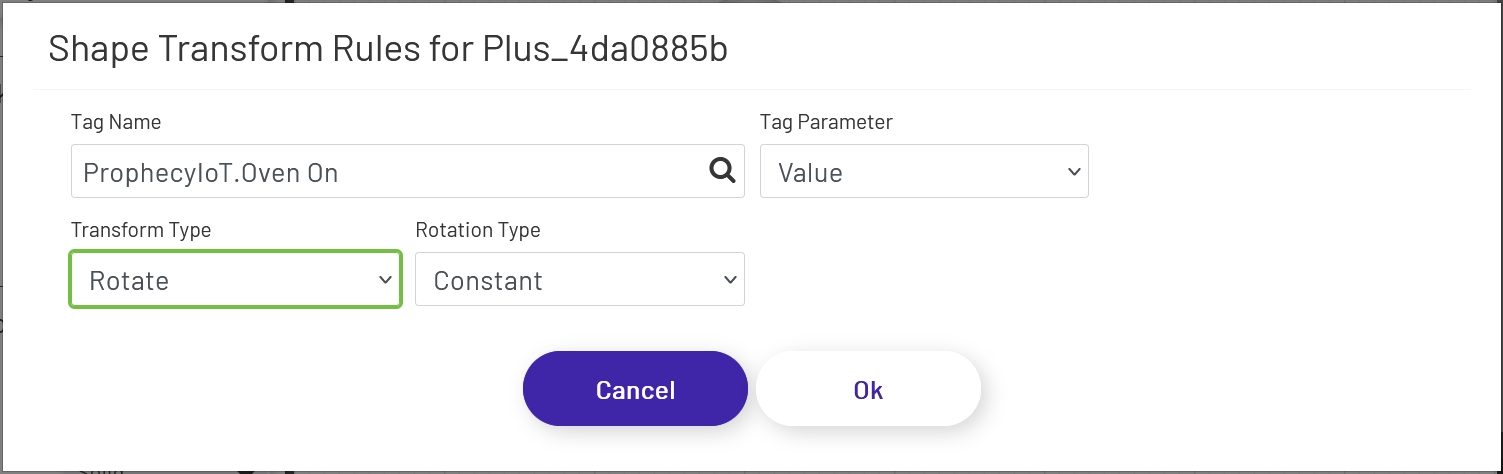
4 - Conveyor belt and other machine shapes were dragged onto the canvas and rotated/resized to create a representation of the line layout. Thanks to shape transform rules, the 'gear' icons layered under the conveyor shapes rotate when a tag value is true, giving an easy indication of whether or not the line is running:
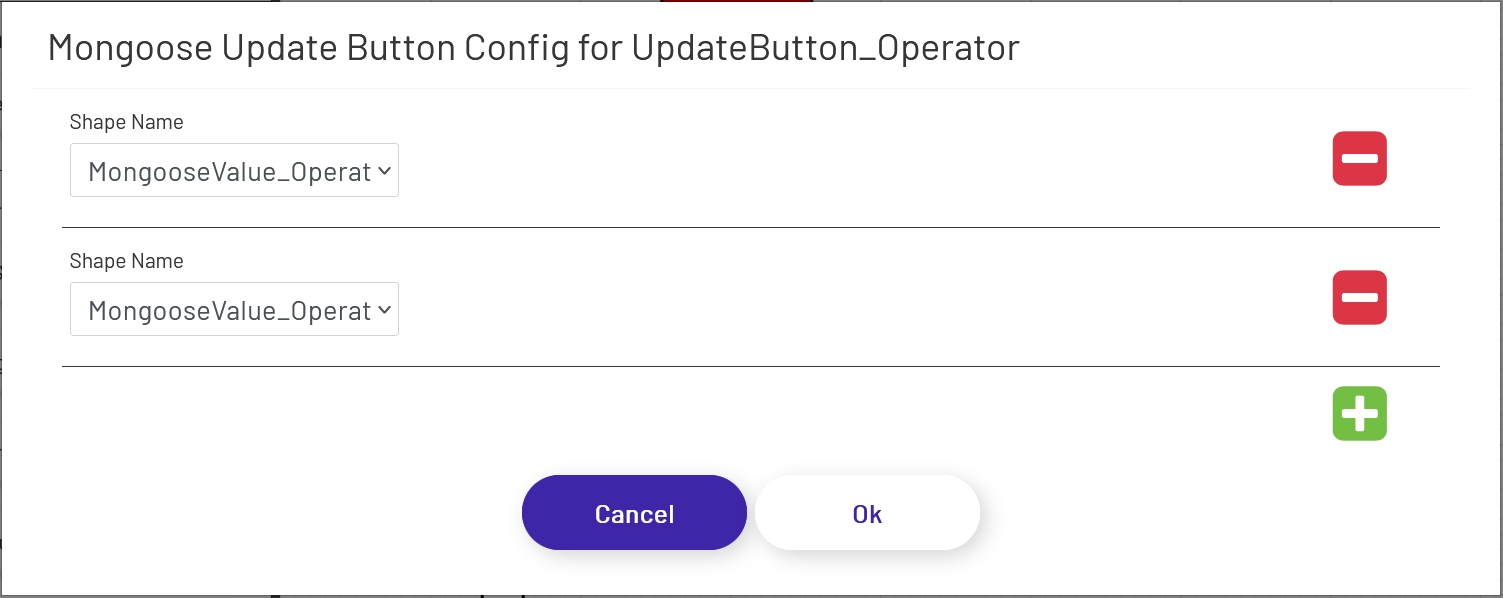
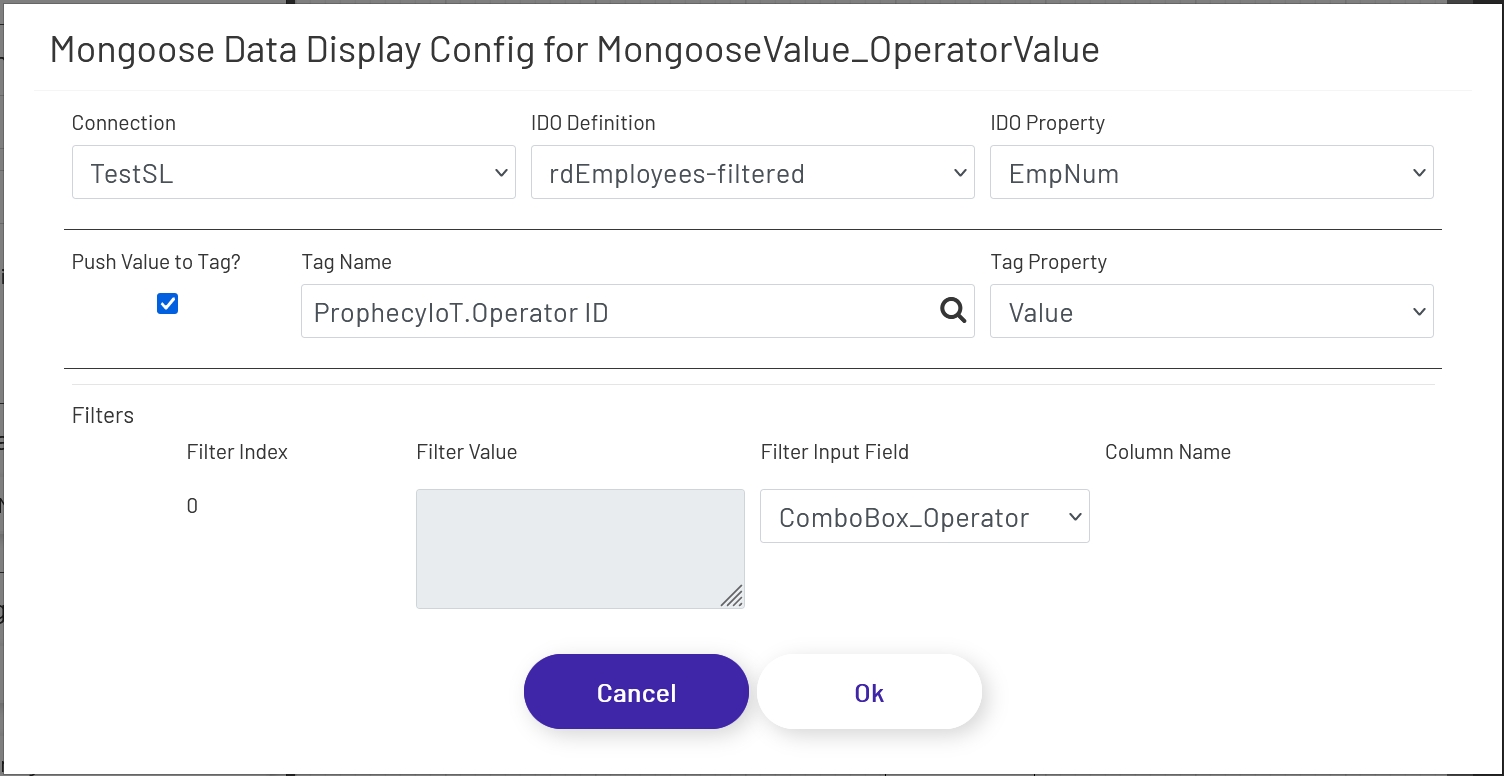
5 - The 'Set Operator' button is a Mongoose update button which tells the diagram to update the Operator Name and Operator Id fields based on the value typed in the combo box at the upper left, which helps ensure accurate data entry.
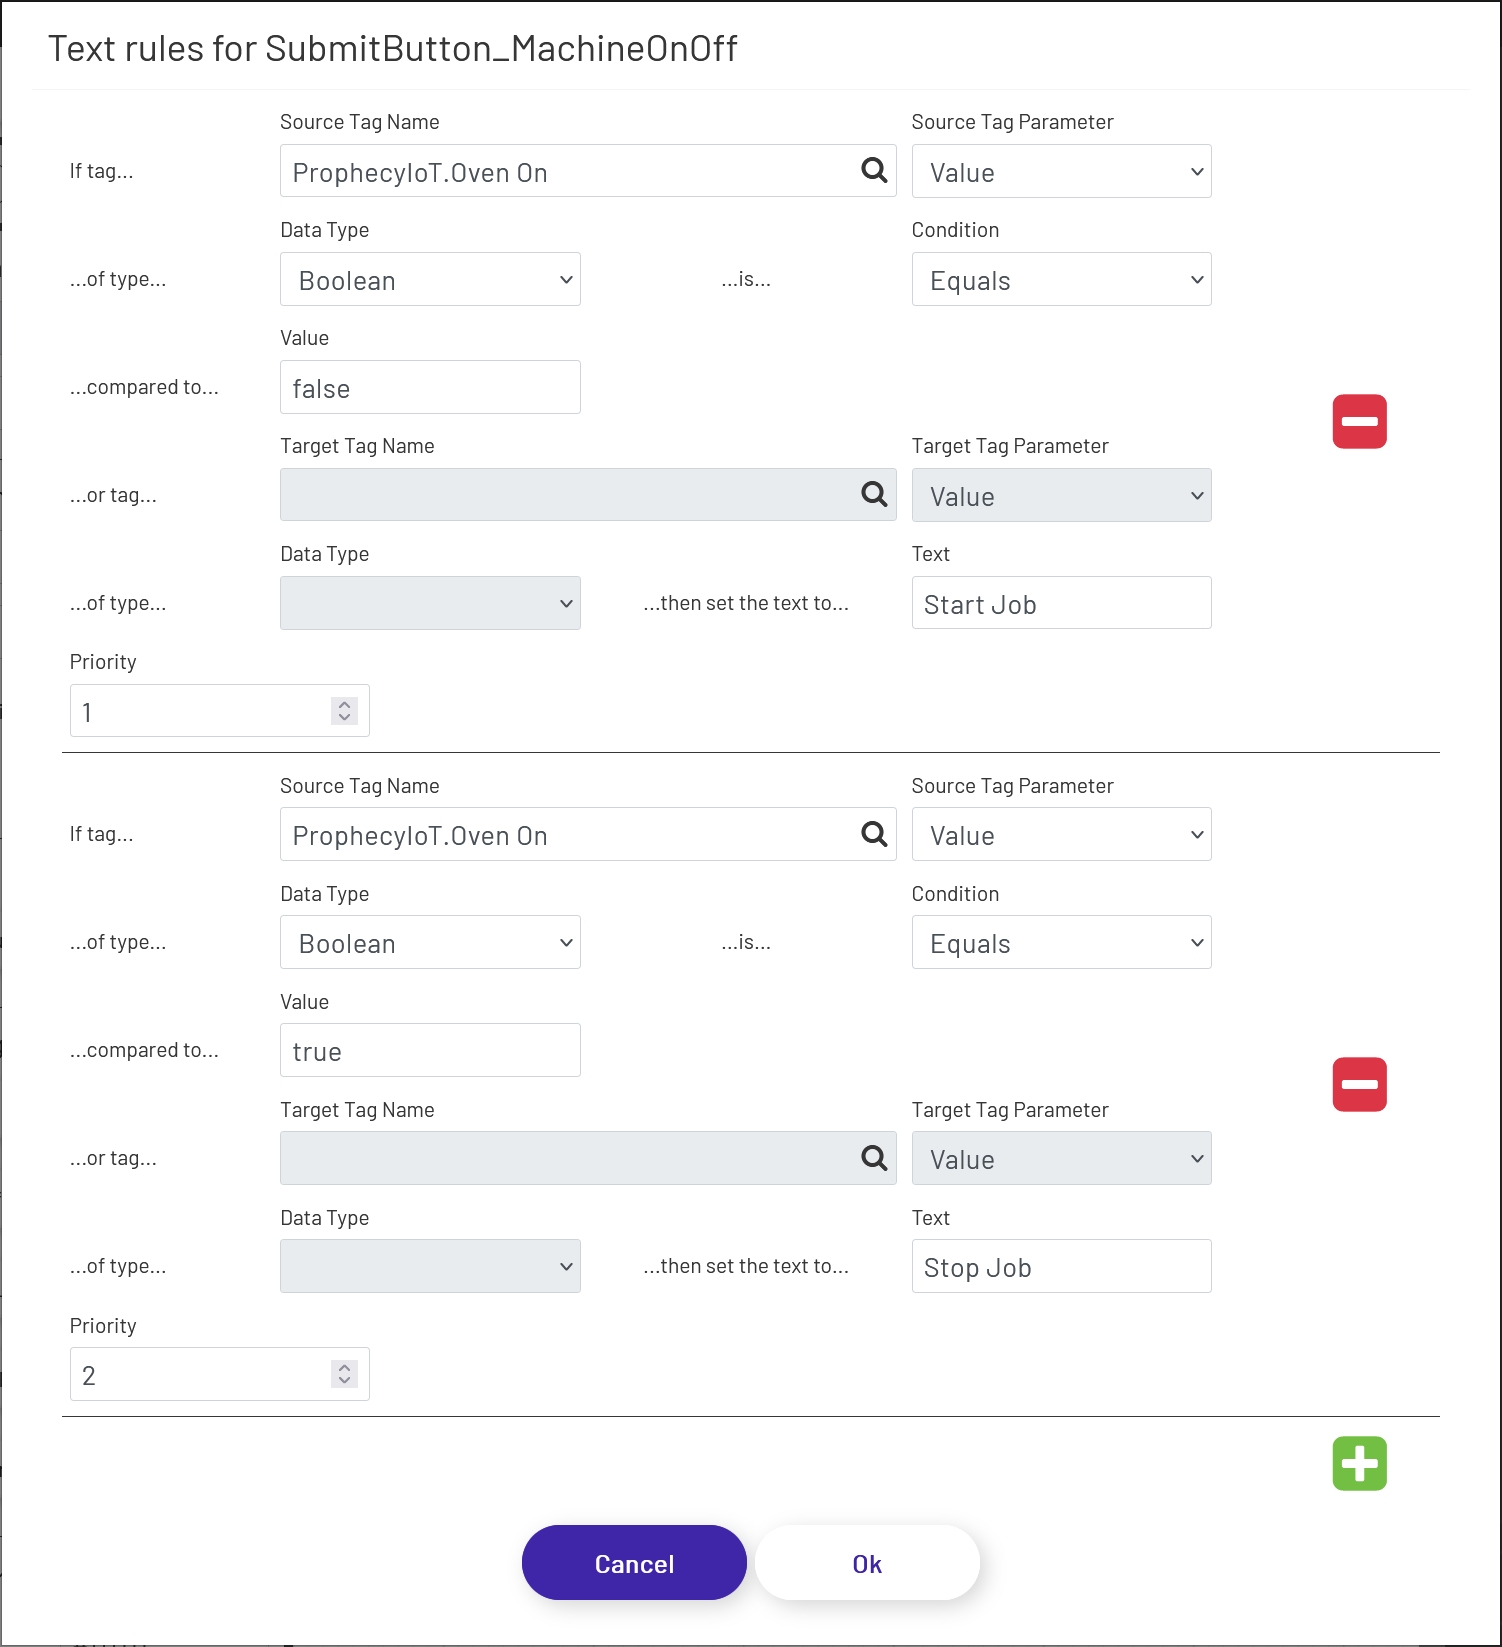
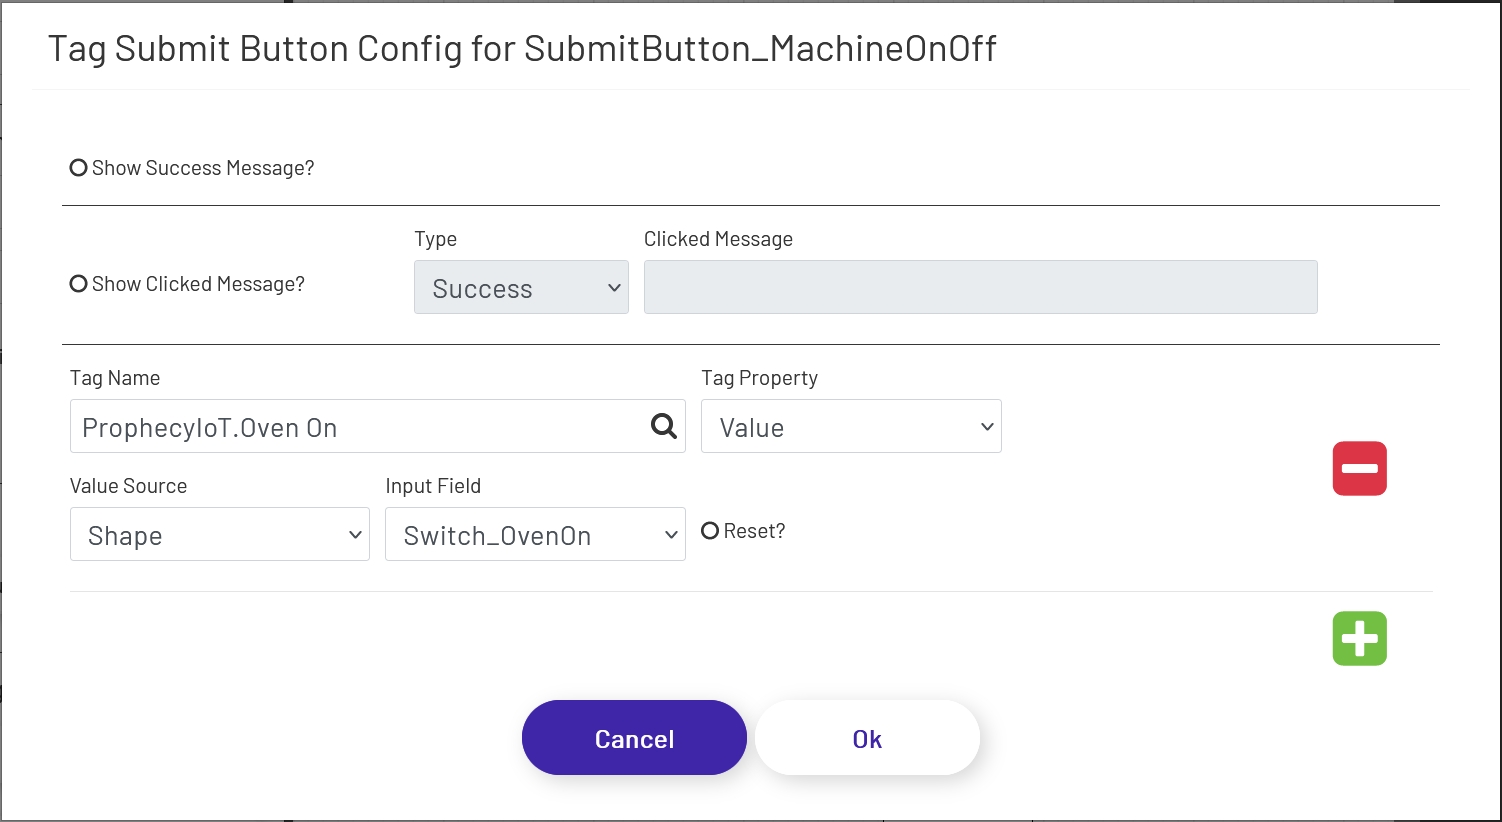
6 - The switch shape at the upper right allows for easy toggling between on/off, so the operator can start and stop the line as needed. The label on the big button right below it changes dynamically based on text rules, and submits the value of the switch to the Data Acquisition Engine.
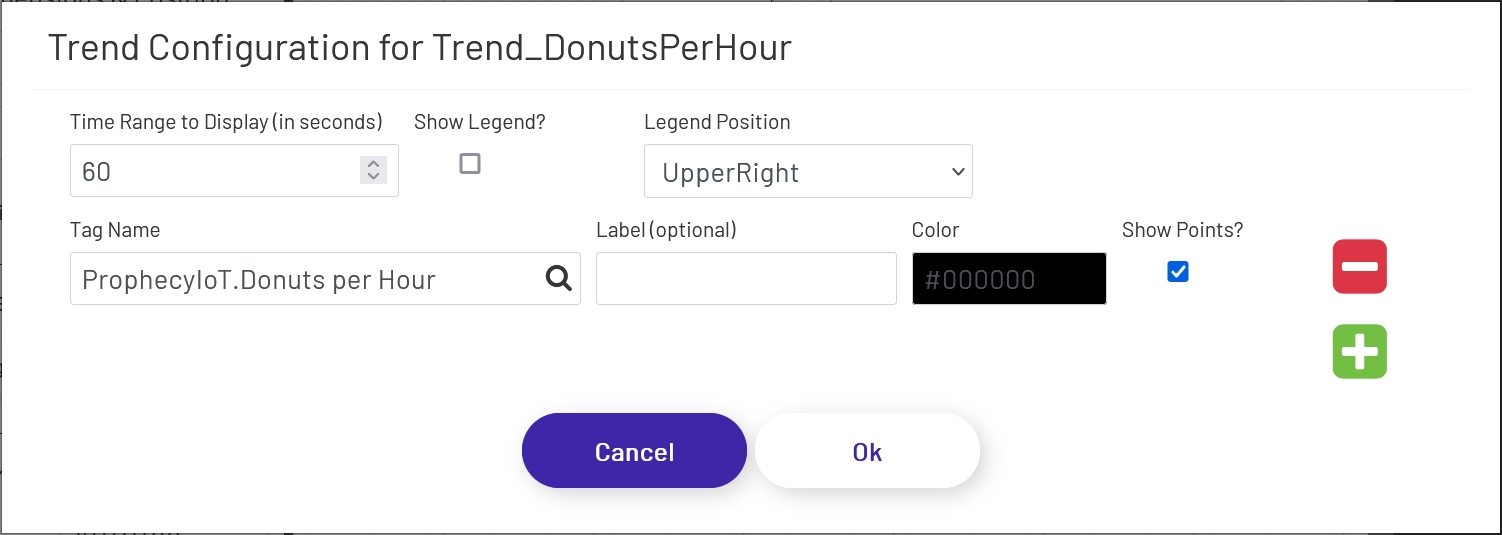
7 - Finally, the trend shape at the bottom of the diagram provides the operator with a recent history of tag data for easy reference.
Notes
There are a few things to keep in mind when building diagrams:
-
Clicking Tag Data and Mongoose buttons in design view will not actually submit the buttons. The diagram needs to be in live mode for buttons to function.
-
Shapes already on the diagram can be copy/pasted, for faster setup. As long as only a single shape is copied at a time, any rules, text, resizing, etc. done on the original shape will be duplicated to each copy, with only the shape name changing. If multiple shapes are copy/pasted at once, config rules will not be duplicated to the new copies. CTRL-C and CTRL-V hotkeys will work to copy/paste shapes in most cases, however browser interactions will sometimes prevent those from working. In those cases, the top menu provide Copy and Paste options under Edit.