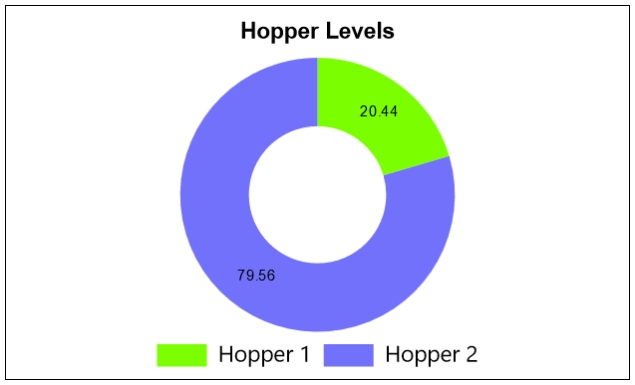
Pie Chart shapes provide a familiar display format for multiple pieces of machine data at one time.
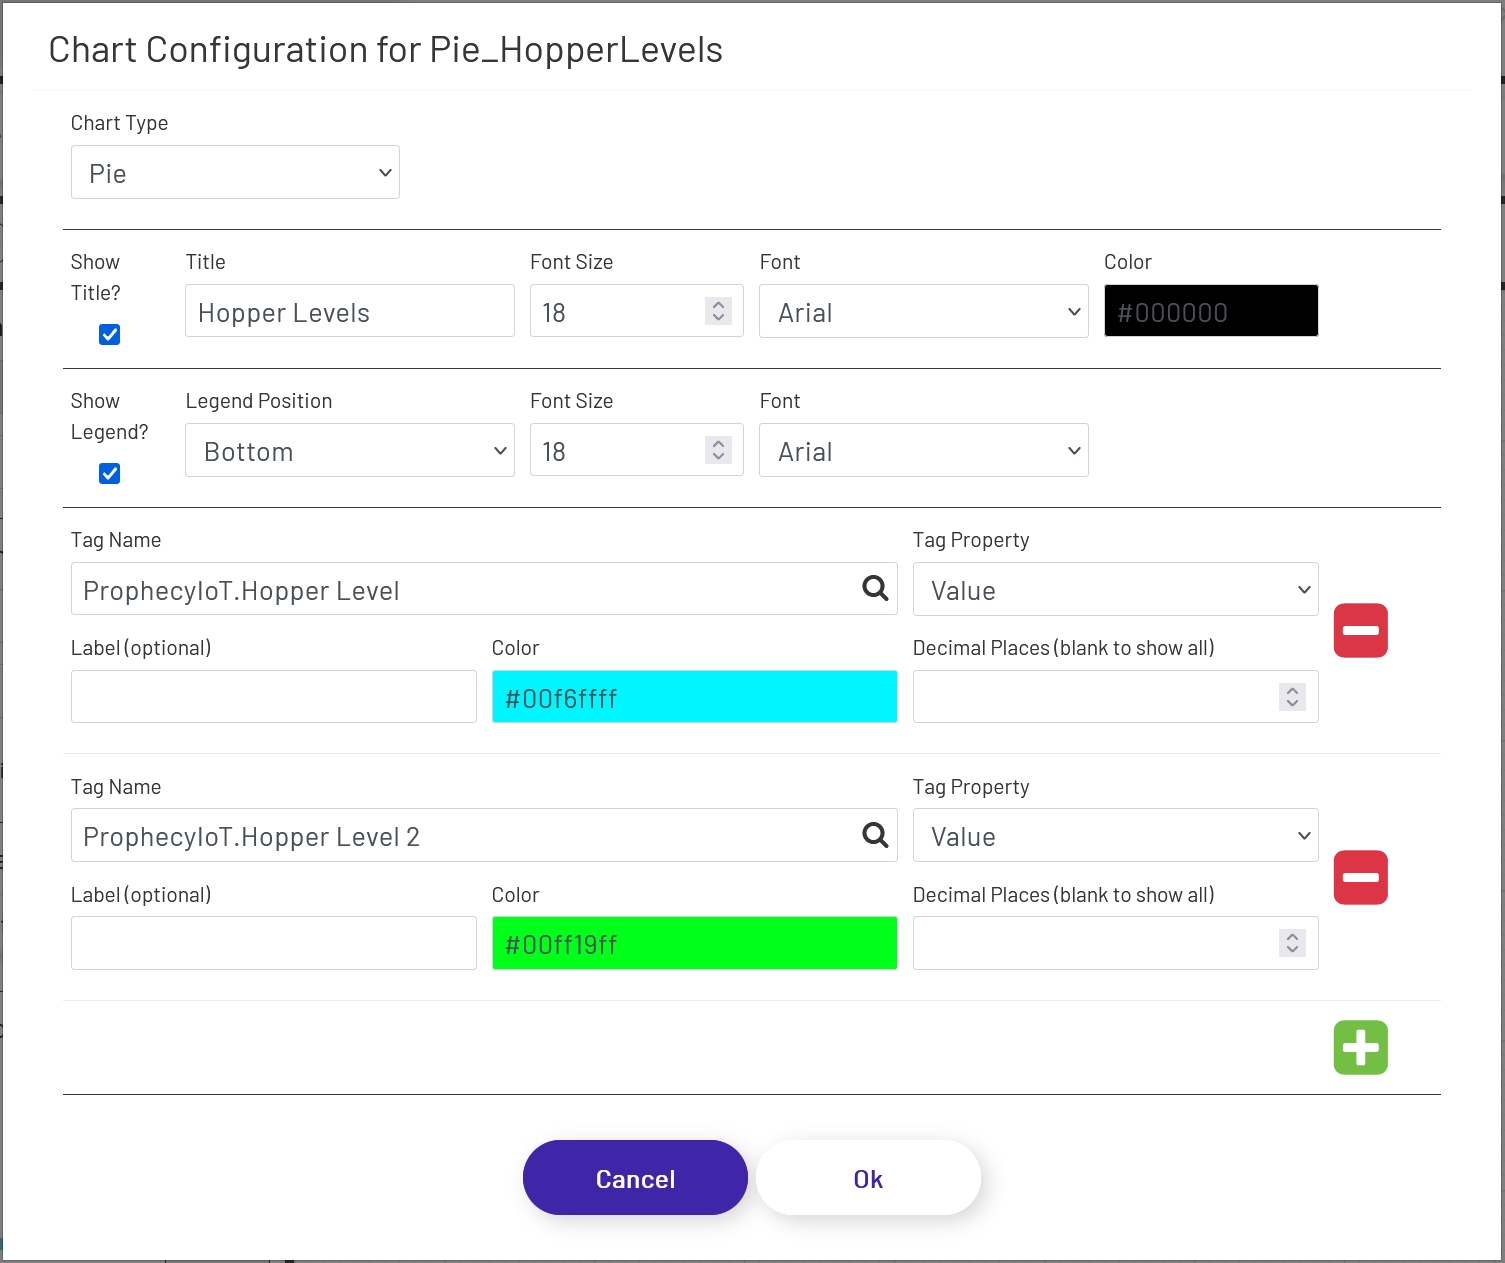
To add a pie chart to a diagram, drag the shape onto the canvas from the 'Live Data Shapes' section of the palette. Once the shape is on the canvas, click the 'Configure Pie Chart' button in the left panel to configure which tag values will be shown and what the chart will look like:
- Chart Type: Choose either 'Pie' or 'Doughnut'. The functionality of each is the same; this setting only changes how the chart looks on the diagram.
- Show Title?: If checked, a title will appear above the chart.
- Title: If 'Show Title' is checked, this is the text that will appear above the chart.
- Font Size: The font size used on the title (if shown).
- Font: The font used in the title text (if shown).
- Color: This sets the color of the text used for both the title and the legend labels.
- Show Legend?: If checked, legend text and color labels will display for each value being displayed in the chart.
- Legend Position: Controls where the legend will display in relation to the chart - top, bottom, left, or right.
- Font Size: The font size used on the legend (if shown).
- Font: The font used in the legend text (if shown).
Each tag being shown in the chart has the following config options. Use the + and - icons on the right to add and remove tags that will be shown.
- Tag Name: This dropdown allows the designer to choose which tag's value will be shown. Click the magnifying glass icon to open the tag selector window.
- Tag Property: This is the tag parameter whose value will be shown in the chart.
- Label: If a value is entered here, it will be used for the label text for that tag (if labels are enabled). If left empty, the tag name will be used.
- Color: This sets the color that will be used for the tag value in the pie chart.
- Decimal Places: It is not always preferable to show the value to the full level of precision, not to mention it would look bad in the chart! It will rarely be important for an operator to know that a value is exactly 37.8427144109. Setting a number of decimal places to truncate the value to in this field will trim that to a value like 37.8427. Note that this is a simple truncation - no rounding is done.