Each Dashboard and Report has its own set of parameters that can be adjusted as needed. All Dashboards and Reports have a default date range set at the time of installation. For dashboards, the default date range is 7 days. This 7-day range includes the current day plus the previous 6 days. For reports, the default is 31 days. This includes the current day plus the previous 30 days.
Note: Only a few of the optional settings are covered here. Reference Dashboards to view more information on configuring Dashboards.
Note: All Reports have date filters that will allow the date range to be opened and closed as needed. It is not recommended to change the default setting to more than 30 days.
Edit Mode
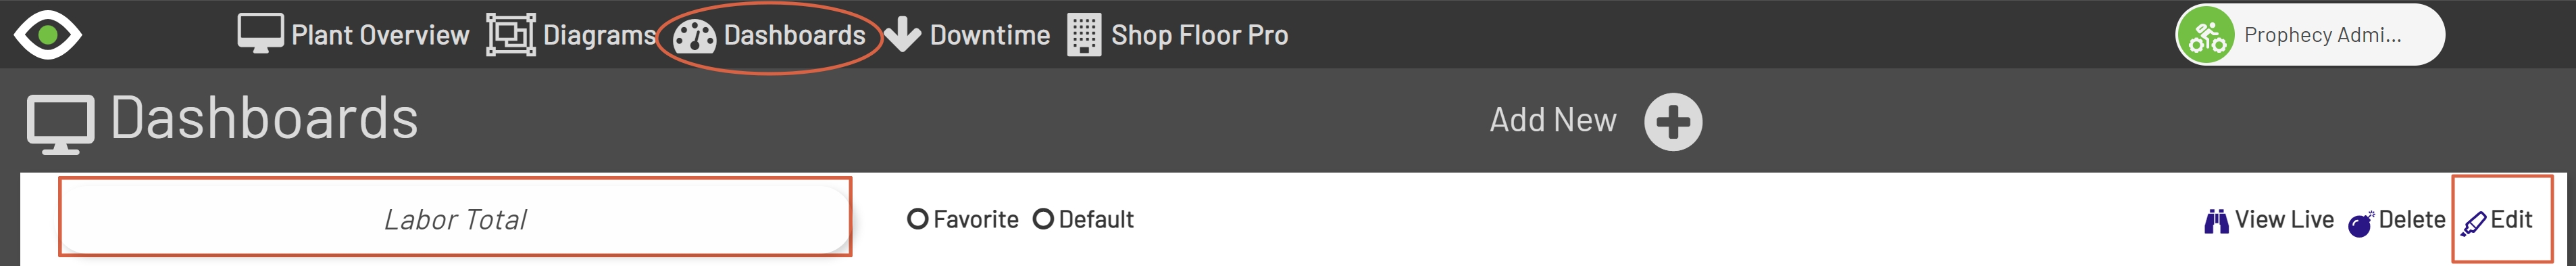
To change the configuration for any Dashboard or Report, navigate to Dashboards by clicking the Dashboards link in the Top Menu Bar. Once the Dashboards page opens, select the desired Dashboard from the Dashboards drop-down. After the Dashboard has loaded, click the Edit button at the far right of the dashboard’s menu bar to put the dashboard in an editable state.
Labels
By default the Dashboard title labels and X and Y labels are turned off. This was done intentionally for these items to present better in Plant Overview. These lablels can be re-displayed by following the steps below.
Dashboard Title
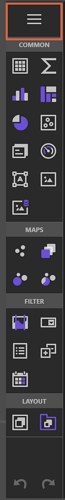
While in Edit mode, click the Hamburger menu at the top of the Designer Toolbar.
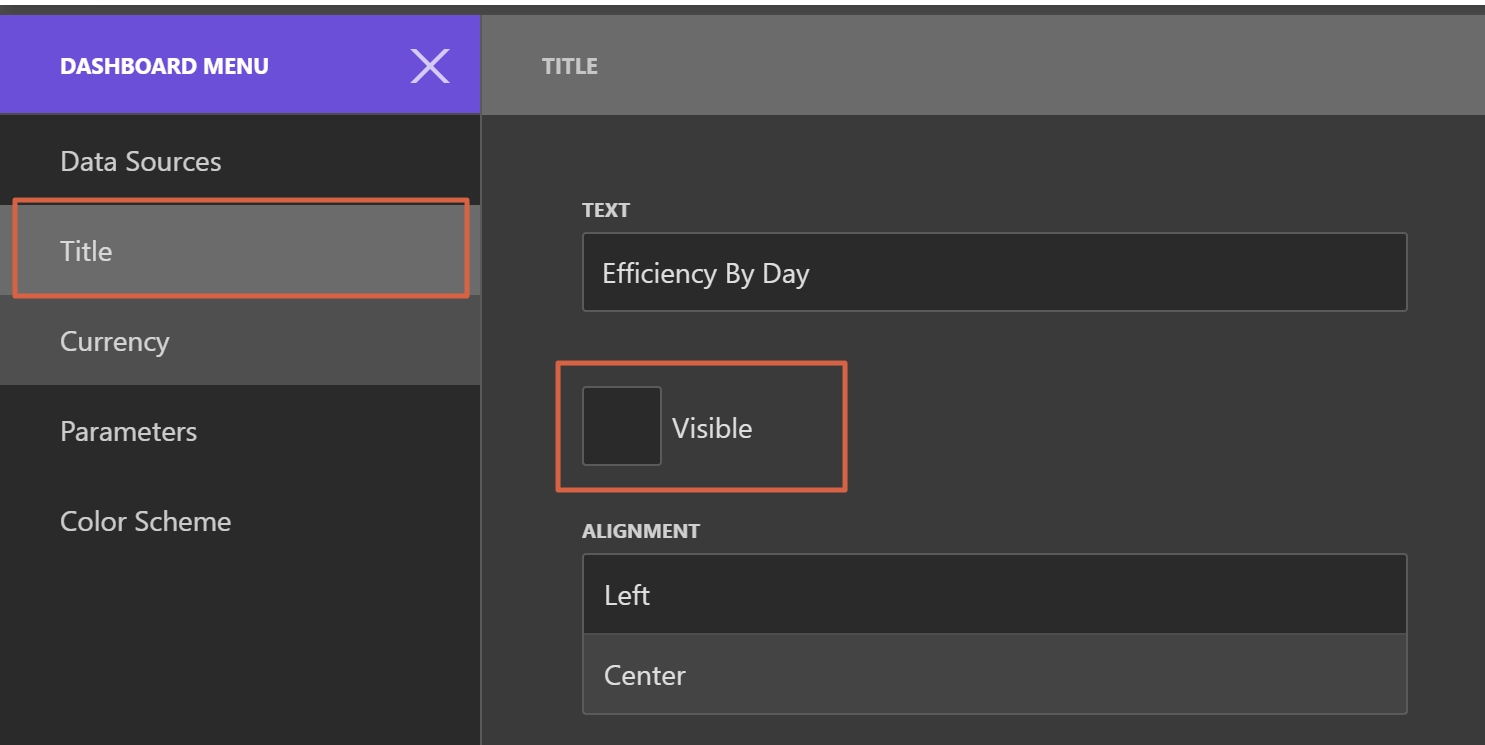
From there, select the Title option and check the Visible checkbox.
X Axis Label
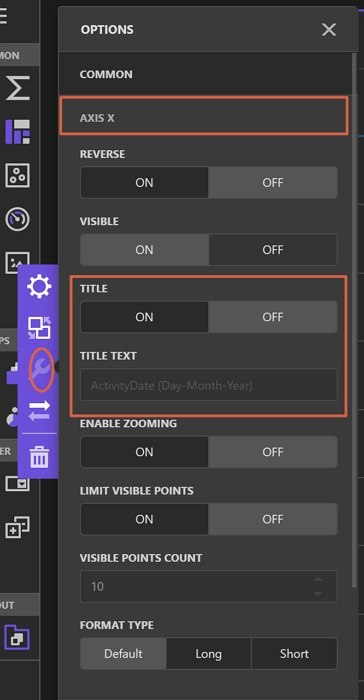
While in Edit mode, click on the Dashboard. This will display the Dashboard Settings menu. Click the wrench on this menu, select the Axis X option, then set the Title to ON. The Title Text can be modified by entering a value in the Title Text Option.
Y Axis Label
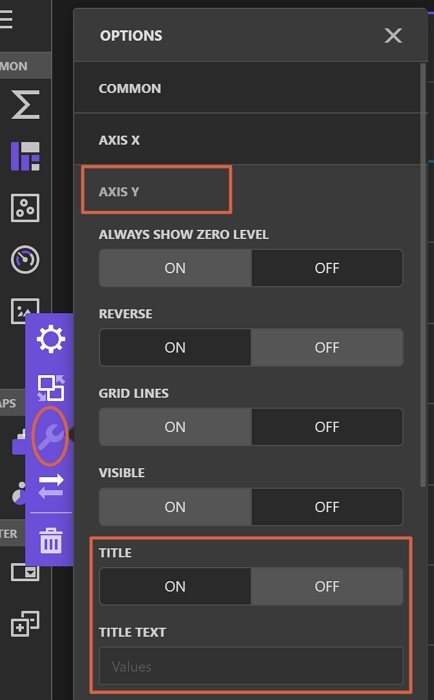
While in Edit mode, click on the Dashboard. This will display the Dashboard Settings menu. Click the wrench on this menu, select the Axis Y option, then set the Title to ON. The Title Text can be modified by entering a value in the Title Text Option.
Configuring Parameters
While in Edit mode, click the Hamburger menu at the top of the Designer toolbar.
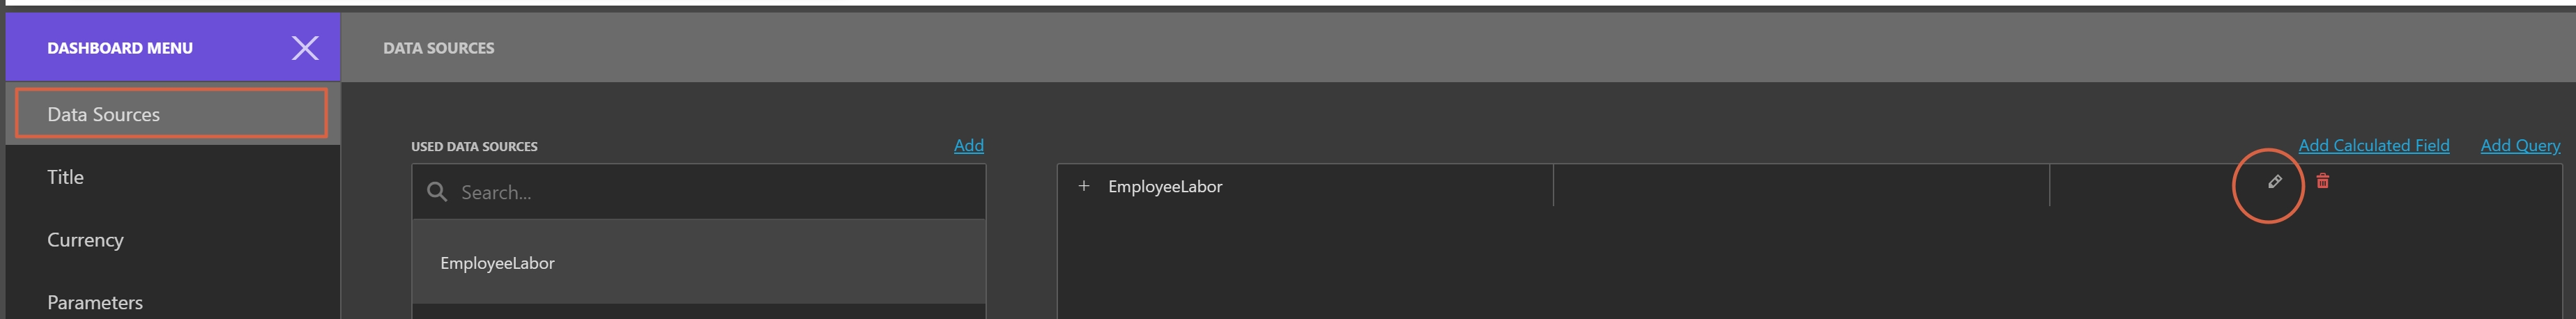
From there, select the Data Sources option. Then in the Query Window to the right, click the Pencil icon.
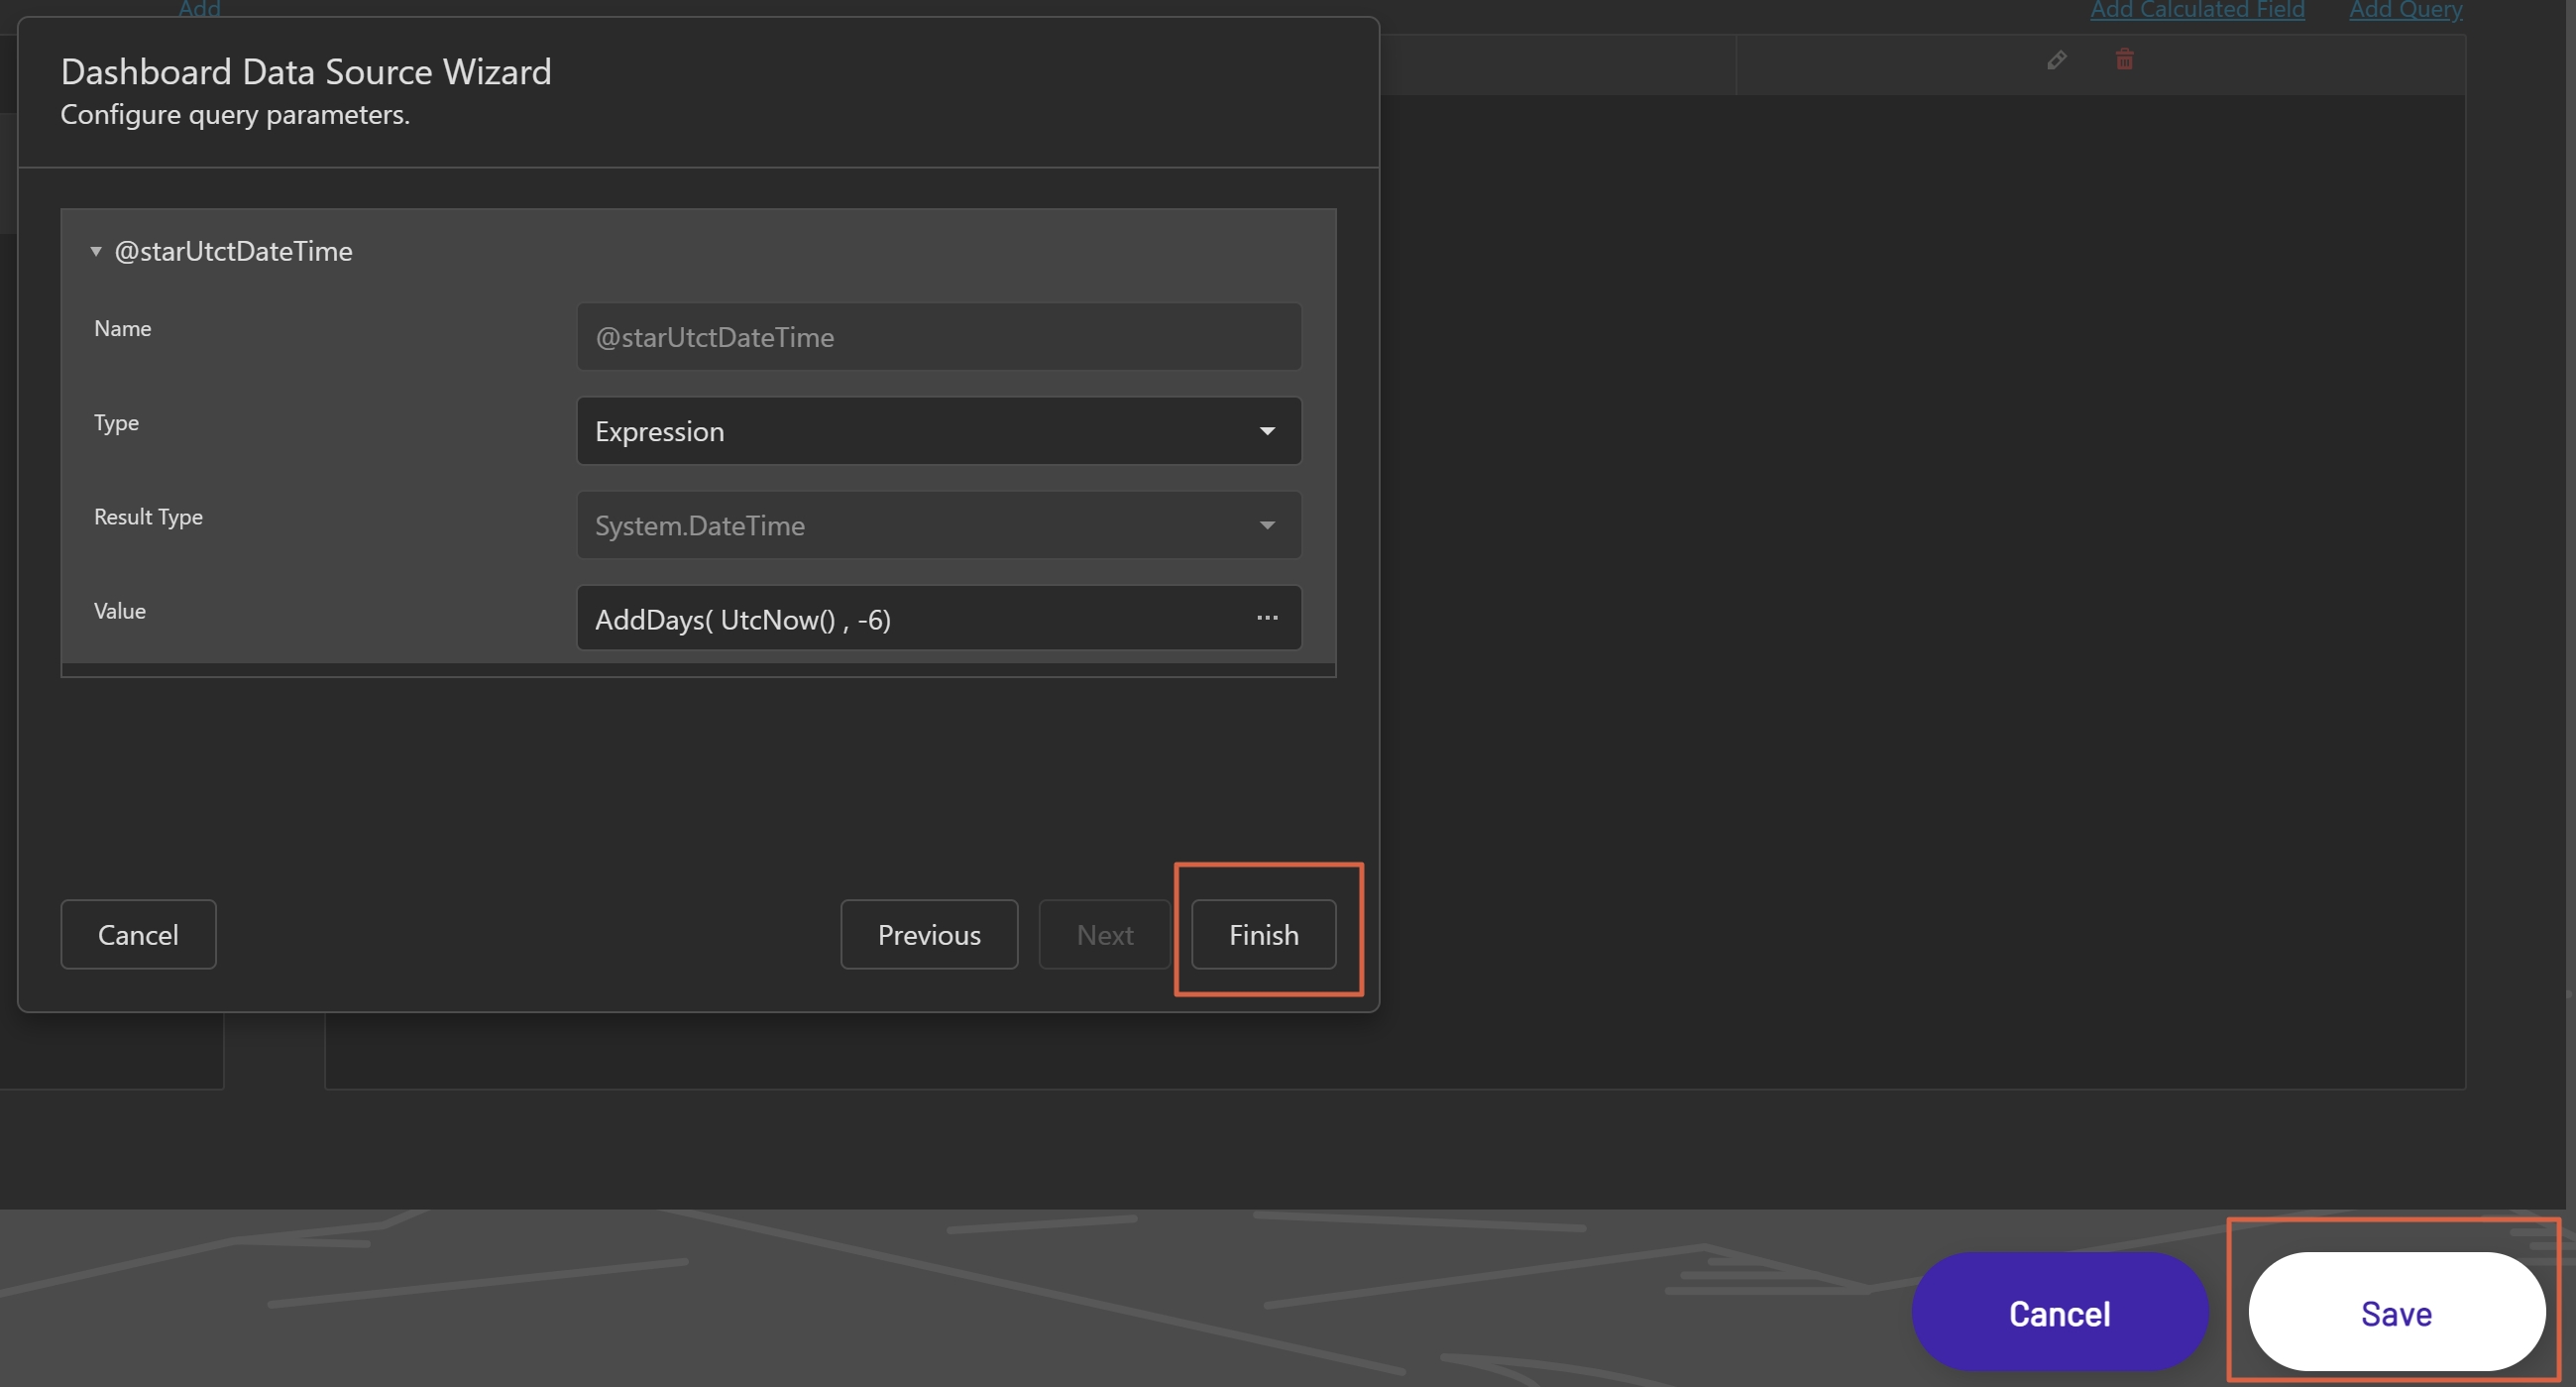
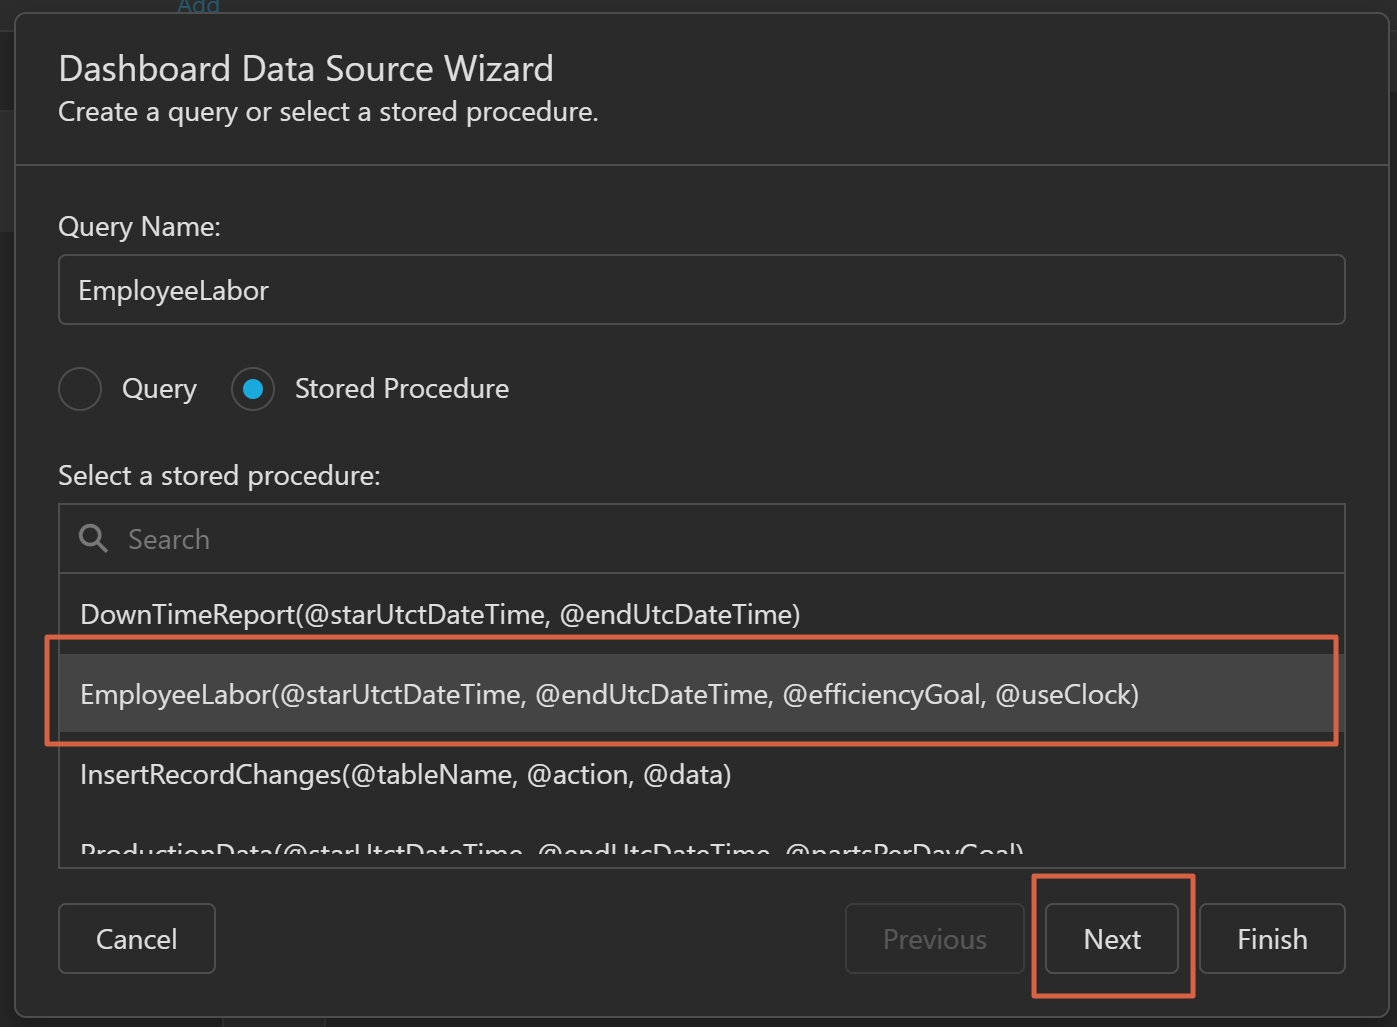
This will open the Dashboard Data Source Wizard. The default Data Source should be pre-selected. Click the Next button at the bottom of the window.
After clicking the Next button, the parameters list for the Dashboard should be visible.
To change a parameter, click on the parameter. This will show all options available for the parameter.
Date Parameters
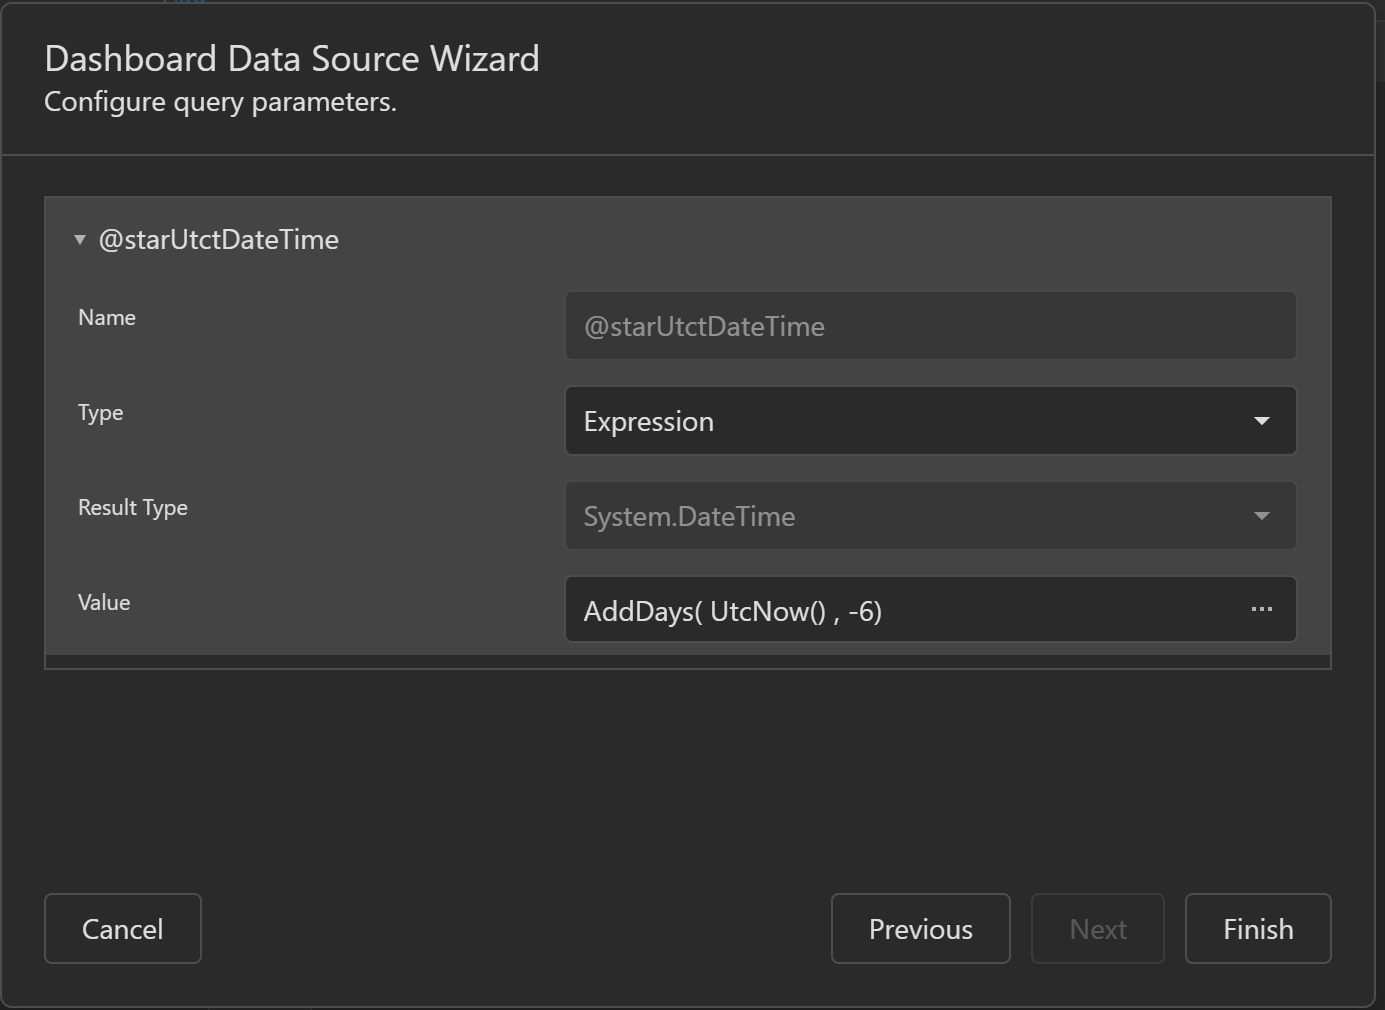
All dates for pre-built reports are stored in UTC time (Universal Time Coordinated). Dashboards default to the current UTC date for the End Time and the current UTC date minus 6 days for the Start Time, to give a total default range of 7 days. The default type for these Parameters is Expression. This can be changed to Date and will allow a static date to be entered. This is not recommended as it will cause the Dashboard to no longer use a dynamic date range.
To adjust the '@StartUtcDateTime', click on the '@StartUtcDateTime parameter and change the -6 in the expression to subtract the desired number of days from the current UTC date and time.
If desired, the '@StartUtcDateTime' parameter can be set to use a date other than the current UTC date. For example, if the '@StartUtcDateTime' parameter needs to be set to the previous day, simply change the expression to read AddDays( UtcNow() , -1).
Saving Changes
Once all parameters have been set, click the Finish button at the bottom of the Dashboard Data Source Wizard window and then click the Save button at the bottom of the Dashboards page to save changes.