One of the most valuable uses for diagrams is creating HMIs and Operator Interfaces, which can be displayed near machines for operators to interact with. These can be used to display realtime machine data from tags, information from CSI through ERP tags, and data from external databases using database tags. ERP tags and database tags can also be used to insert and update data in the backing data sources. These interfaces may be as simple as a few shapes to display live machine data, or complex enough to control whole lines as well as display valuable metrics to operators and management. Here we'll go over some of the elements of an example HMI to give examples of what can be done:
Note - This HMI uses some of the more complex features available in Prophecy to achieve its purpose. This is meant to be used as an example of what is possible through Prophecy.
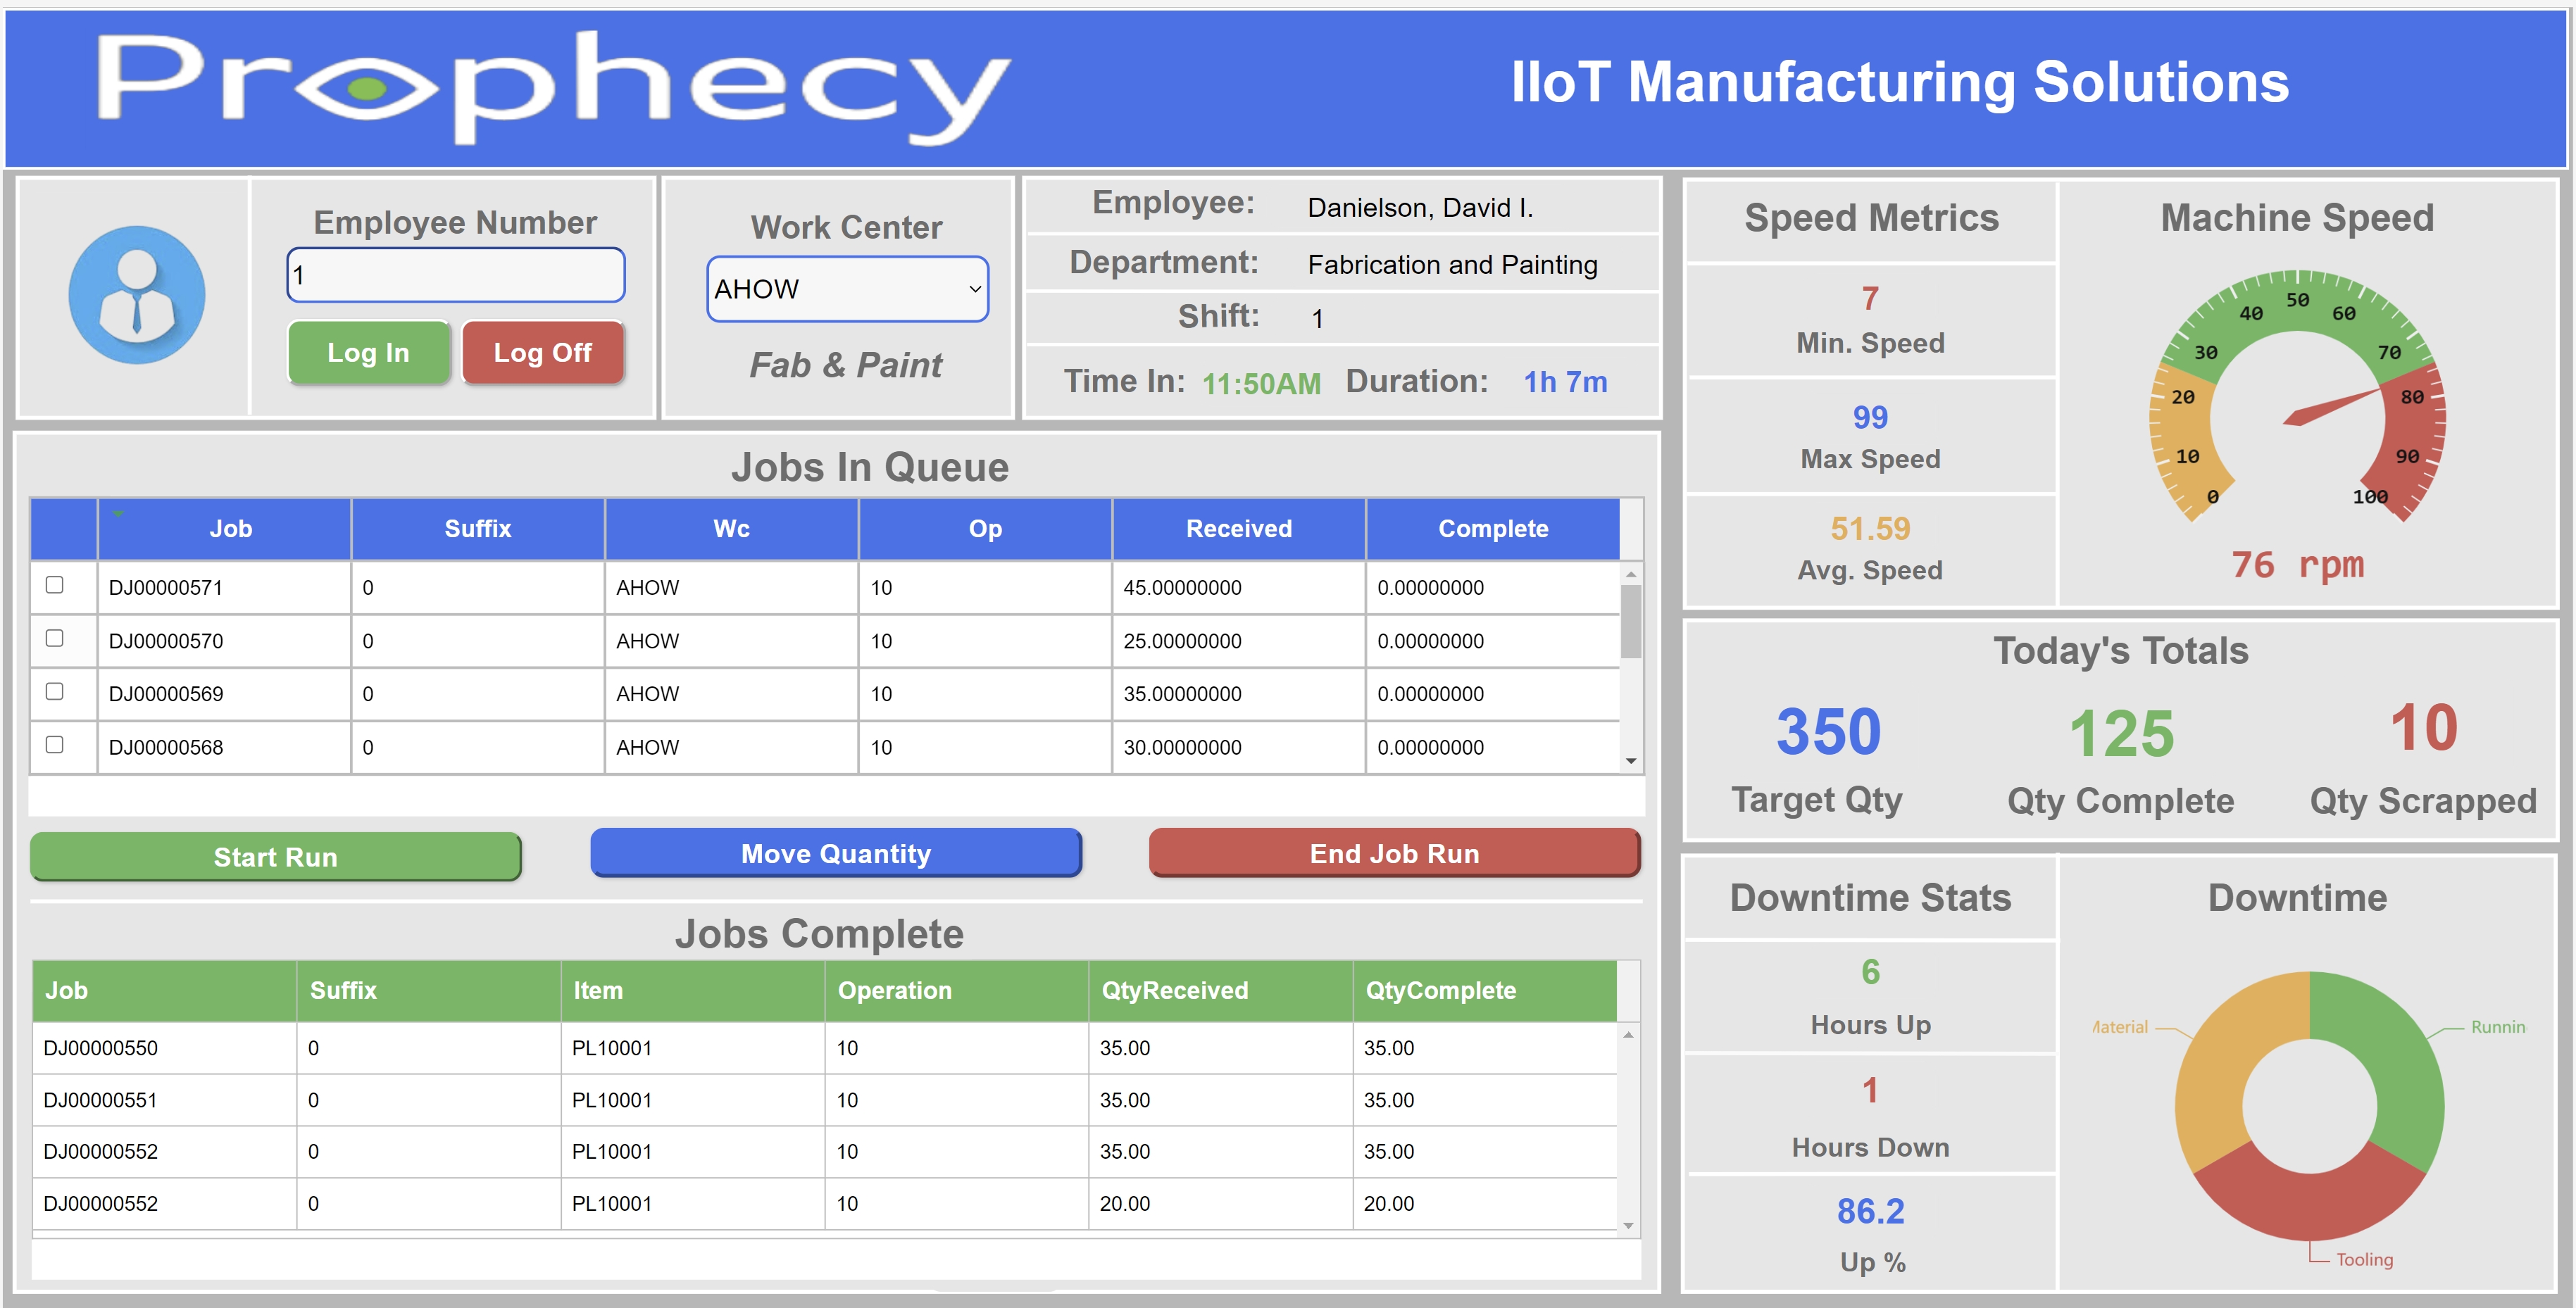
The sample HMI above combines a number of the available diagrams features to create an operator interface HMI, as well as adds some valuable real-time operator and management metrics. Below is a feature breakdown and explanation.
Employee Section
The top left section of the HMI allows an operator to log in or off of their shift by entering an employee number and then clicking the 'Log In' or 'Log Off' submit button. The 'Log In' and 'Log Off' buttons trigger multiple events attached to the button click.
-
Log In: Clicking the log in button will trigger events attached to the button. The first event triggered takes the value entered into the 'Employee Number' field and writes this value to a storage tag. Next, an event is triggered for a script tag. The script tag reads the value of the logged-in employee storage tag and makes a call to an ERP tag using the employee number to validate that the employee is valid in Syteline. If this check passes, the script tag sets a storage tag to 'Employee logged in successfully'; otherwise, a storage tag is set with a message of 'Invalid Operator', and this message is displayed to the operator. Upon the successful entry of an employee number, the transition of a storage tag from false to true triggers a workflow rule that disables the 'Log In' button. The next event then triggers a write action to a database tag that writes the employee information to a database, capturing the time the employee logged in, as well as other information relevant to the employee state. The final action that is triggered is a tag refresh to update other dependent tags used in the HMI.
-
Log Off: Clicking the 'Log Off' button triggers events attached to the button. The first event triggered is a call to a writeable database tag. The query behind the database tag uses the employee number of the currently logged-in employee to update the database record with the time the employee logged out. Next, other storage tags being used in filters for objects in the HMI are set to 'null' (these filter tags are mentioned throughout this page). Setting these values to null will cause the dependent ERP and database queries to return empty record sets that will clear the values on the HMI. The last event triggered is a tag refresh. This event will effectively clear the HMI. Default values are used in the tag shapes so that the blank values are displayed for empty record sets.
Work Center Section
The top middle section of the HMI allows the employee to select a work center from a dropdown. The dropdown is populated from an ERP tag. Once a work center is selected, events are triggered that set a storage tag with the selected work center and trigger a tag refresh event to update other areas of the HMI.
Employee Information Section
The top right section of the diagram is used to display information about the logged-in employee. The first three fields are derived from an ERP tag that is filtered using the employee number stored in a storage tag that was set when the employee logged in. The time section uses a database tag that is filtered using the employee number storage tag mentioned above to get the time the employee was logged in and calculate the shift duration of the logged-in employee. The database tag used to display the duration is set to a one-minute polling interval, so that the duration is always current.
Job Information Section
The jobs section uses a combination of ERP tags and submit buttons to display job information relevant to the employee, as well as allow the employee to write transactional information back to the ERP using writeable ERP tags.
-
Jobs In Que - The 'Jobs In Queue' grid displays jobs scheduled for the current day using a grid that is populated with an ERP tag. The ERP tag uses storage tags as filters to filter for the current date, selected work center, and job status. The ERP tag behind this grid is set to a one-minute polling interval, so that the grid will automatically refresh with new jobs added to the ERP for the selected work center.
-
Start Run Button - The 'Start Run' button is a submit button that uses multiple events to submit and validate the submission of data, as well as store transactional data in a transaction state database. The first event attached to the button uses a script tag to check against a transaction state database to see if the selected job has already been started. If the job has started, a message is displayed to the operator without further processing. If the job has not been started, then data from the selected job is used to build a transaction state object and submits this data to a database tag that then creates a state record in the transaction state database. The last event action does a tag refresh to update the tags on the screen.
-
Move Quantity Button - The 'Move Quantity' button is a submit button that uses multiple events to submit and validate the submission of data, as well as submit move transaction data back to the ERP. The first event attached to the button uses a writeable ERP tag to submit move transaction data back to the ERP system. This event combines data from the grid, as well as data stored in other tags, to populate all data necessary for the move transaction. The last event action does a tag refresh to update the tags on the screen.
-
End Run Button - The 'End Run' button is a submit button that uses multiple events to submit and validate the submission of data, as well as submit run transaction data back to the ERP. The first event attached to the button uses a script tag to check against a transaction state database to see if the selected job has already been started. If the job has not been started, a message is displayed to the operator without further processing. If the job has been started, the data for the record is stored in a variable, and the transaction state database is updated with the end time of the transaction. Next, the script does a read against the ERP tag that is used to populate the grid and uses the selected records to obtain the job information and stores the data in a variable. Next, a call to the ERP tag that is used for the employee is made to get the logged-in employee information that is necessary for the transaction. This information is also stored in a variable. The last portion of the script takes the information from the previous two variables. It combines all the data necessary to populate a writeable ERP tag that submits the transaction. The last event action does a tag refresh to update the tags on the screen.
-
Jobs Complete - The 'Jobs Complete' grid displays jobs scheduled for the current day using a grid that is populated with an ERP tag. The ERP tag uses storage tags as filters to filter for the current date, selected work center, and job status.
Metrics Section
The metrics section of the HMI displays meaningful information from the machine the HMI is connected to, as well as metrics specific to the jobs for the current day.
The first section is information pertaining to a CNC machine that is running in the Fab & Paint work center. This machine has a direct connection to Prophecy using the Prophecy Data Acquisition Engine. Data points from this machine are captured and logged to a database to provide current and historical reporting data.
-
Speed Metrics - The 'Speed Metrics' section of the diagram uses a database tag and connects to a table containing data for the current machine. This data is filtered by the current shift. Then, multiple values are aggregated from this data set using tags. The aggregations applied to the dataset are Min, Max, and Average. Each of the aggregated tag values uses coloring rules to conditionally format the values depending on the range and visually indicate whether or not the value is within the normal range.
-
Machine Speed - The 'Machine Speed' gauge uses a tag that is directly connected to the CNC machine to give live feedback to the operator every second.
The middle metrics section displays target, actual, and scrap quantities reported against the jobs running on the HMI. The data uses aggregations from the ERP tag that populates the 'Jobs In Queue' grid.
-
Target Quantity - The 'Target Quantity' uses a tag shape to display the sum of the received quantity for jobs in the ERP tag that populates the 'Jobs In Queue' grid.
-
Qty Complete - The 'Qty Complete' uses a tag shape to display the sum of the completed quantity for jobs in the ERP tag that populates the 'Jobs Complete' grid.
-
Qty Scrapped - The 'Qty Scrapped' uses a tag shape to display the sum of the scrapped quantity for jobs in the ERP tag that populates the 'Jobs Complete' grid.
The bottom section is information pertaining to downtime reported against the CNC machine that is running in the Fab & Paint work center for the current shift. Dowmtime events are reported directly from the machine using the Prophecy Data Acquisition Engine. Reasons for these events can be added in one of two ways. The first is directly through the HMI and the second is through the Downtime Stripe in Prophecy. This particular example uses information that was captured using the Downtime Stripe. The data presented in this section uses a database tag to populate the aggregated and caclulated values, as well populate the pie chart.
-
Hours Up - The 'Hours Up' uses a tag shape to display the sum of the hours the machine is running for the current shift using a database tag.
-
Hours Down - The 'Hours Down' uses a tag shape to display the sum of the hours the machine is down for the current shift using a database tag.
-
Up % - The 'Up %' uses a tag shape that is using a calculation tag to calculate the up percentage. The calculation tag divides the aggregated up and down hours from the database tag to calculate the total percentage of uptime for the machine during the current shift. The up percentage uses coloring rules to conditionally format the color of the value to visually indicate to the operator whether or not the machine is running optimally.
-
Downtime - The 'Downtime' pie chart uses a database tag that connects to the database table containing the downtime data for the connected machine. This tag is filtered by the current shift and the machine running at the Fab & Paint work center. The backing query aggregates the downtime by the reasons logged during the shift.