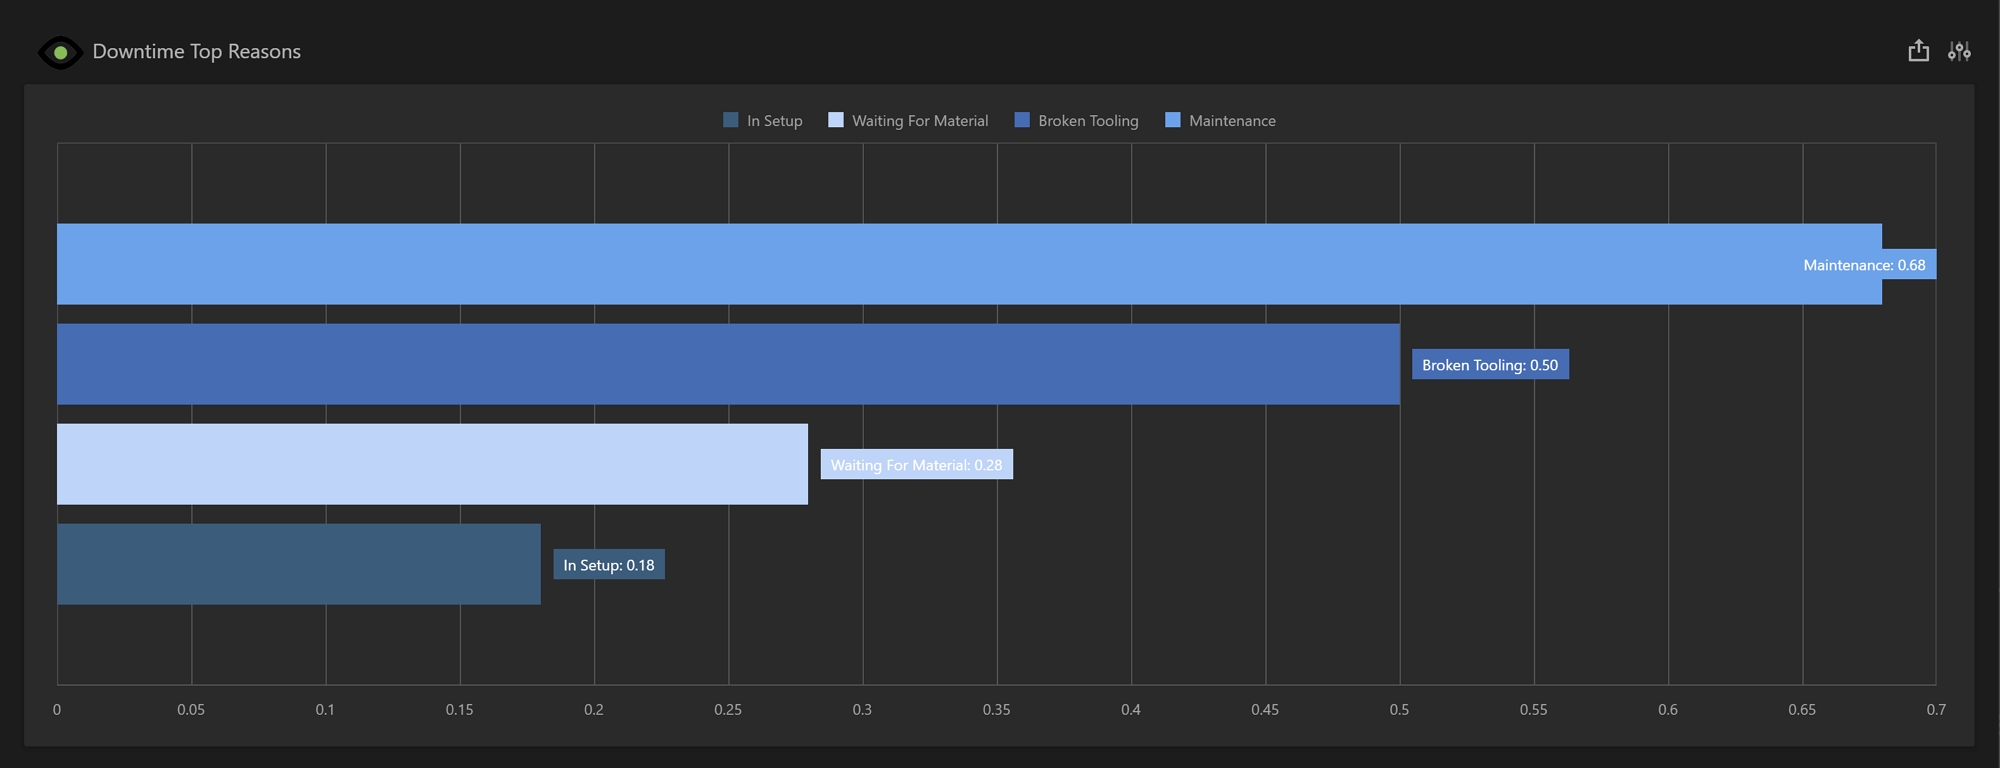
The Downtime Top Reasons dashboard displays a bar chart showing the top reasons contributing to downtime over a period. This dashboard defaults to a date range of 7 days and the top 5 contributing reasons. The default date range is the previous 6 days plus the current day. The time frame and machine count can be adjusted by following the steps outlined here.
Note: Downtime must be fully configured in Prophecy before this report will display any data.