The Downtime setup screen is reached by clicking on Downtime in the top nav, and then the Setup link at the upper right of the main Downtime page. Only members of the Admin and Supervisor roles will see that Setup option.
There are 3 major aspects of Downtime setup:
Machines
Machines are the main organizer of downtime data, of course. Runtime data is collected per machine, operators are assigned to machines, and downtime reasons are entered into the timeline by machine. To add or edit a machine, use the buttons below the Machines grid:
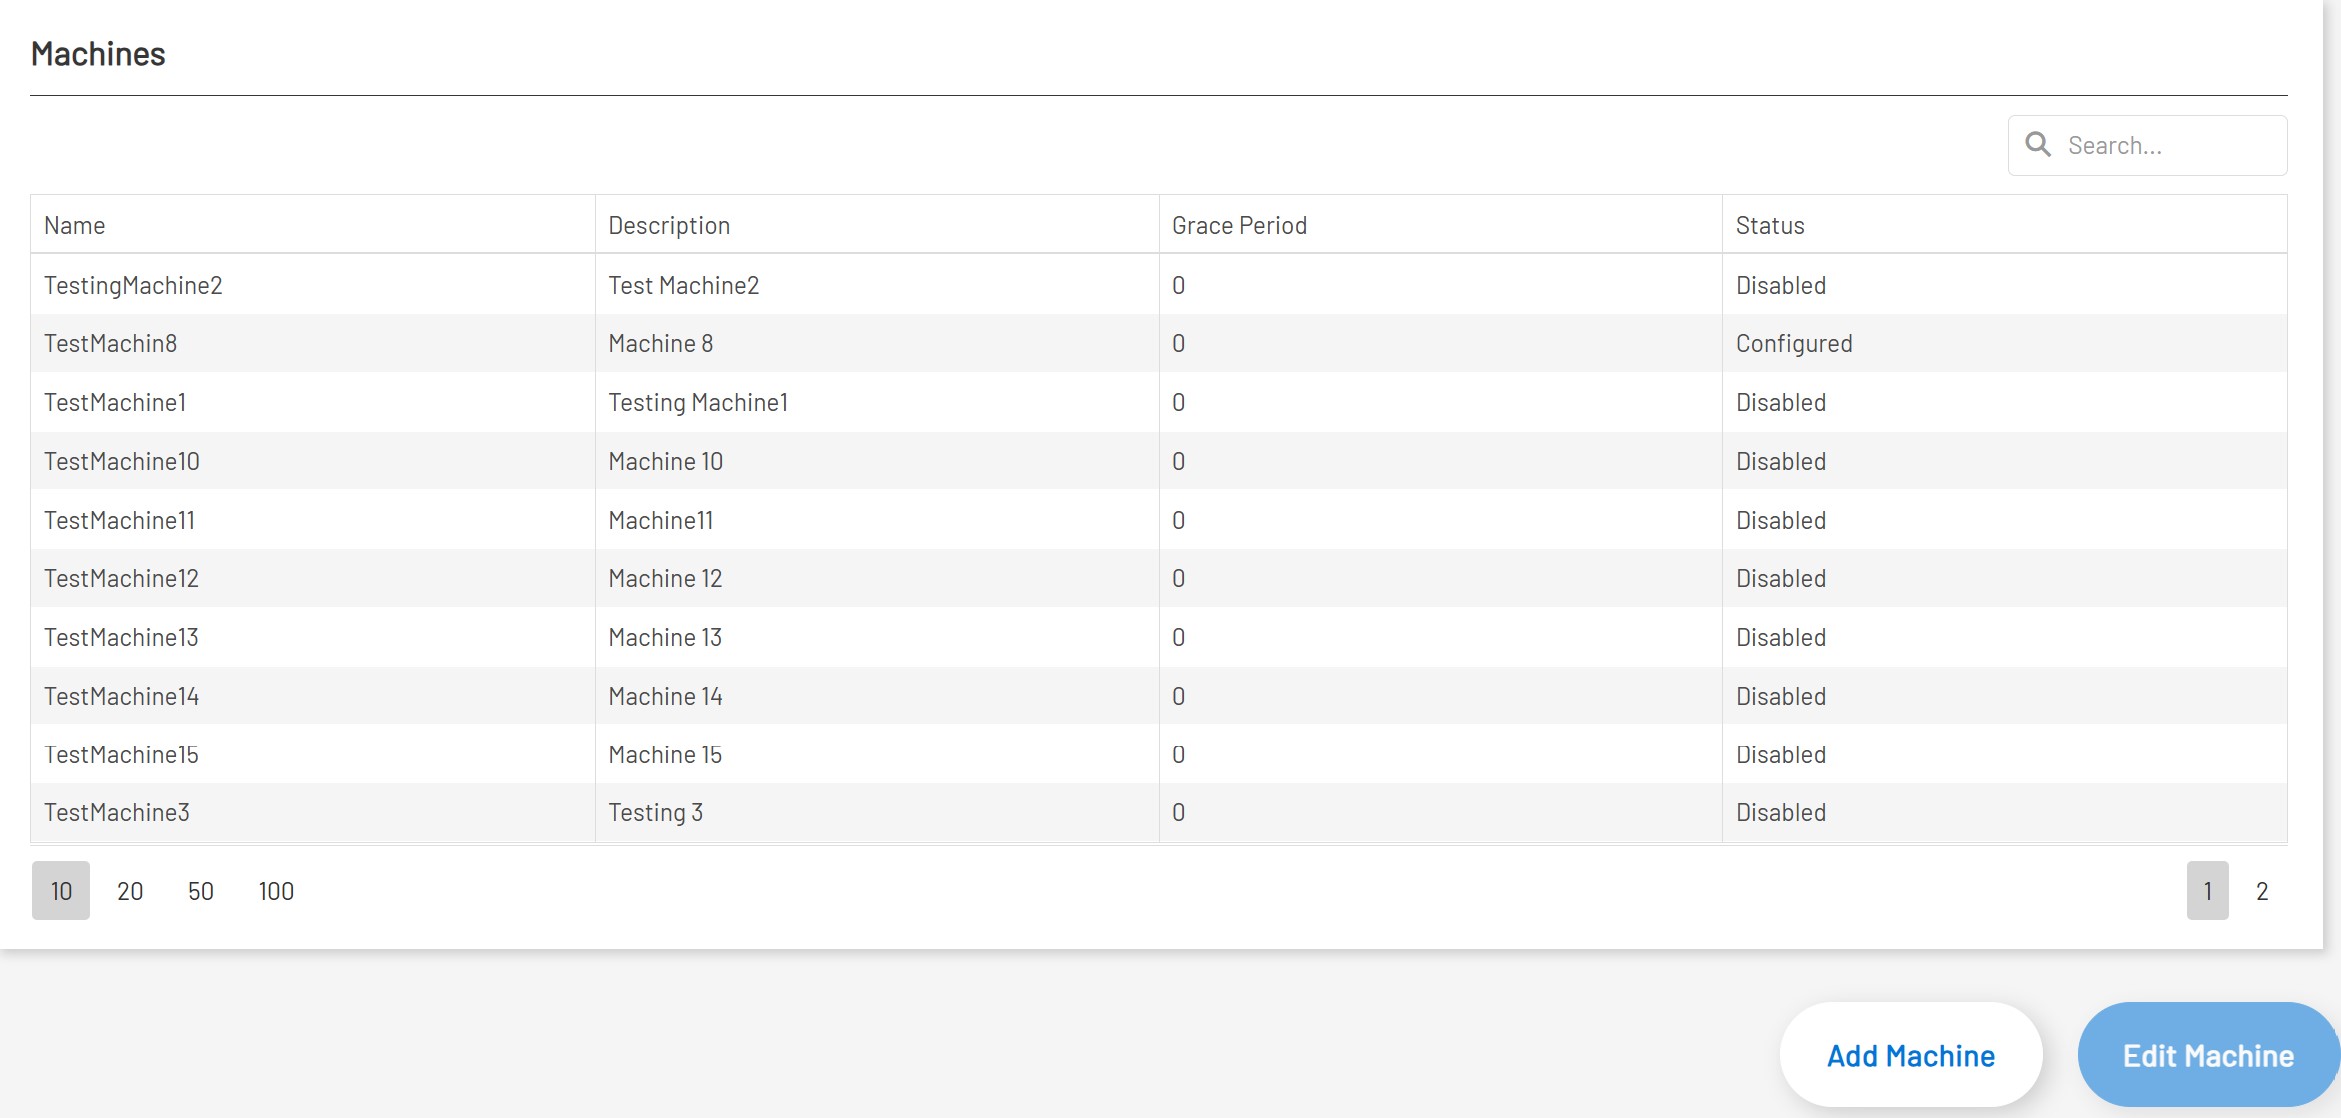
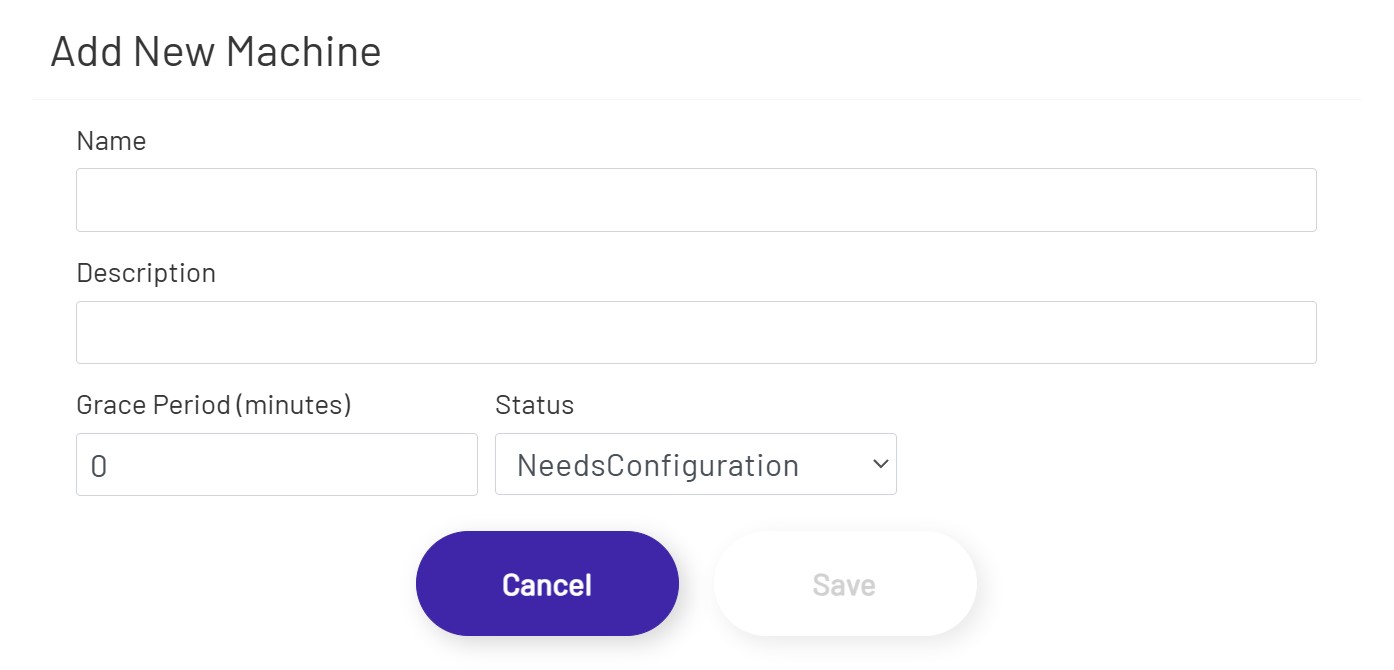
There are only a few pieces of information required to do the initial machine creation in Prophecy:
-
Name: This will be displayed several places on this setup screen, and is used by operators on the timeline page to filter down to the downtime data they need to manage. This name is used to create a tag and data logging group in the Data Acquisition Engine, so each name must be unique and cannot be changed.
-
Description: This is an optional field, and is only used for informational purposes on this screen.
-
Time Zone: This should be the time zone the machine is physically located in. This is important, as all times selected and displayed on the timeline page will be in this time zone, regardless of where the page is being viewed from.
-
Grace Period: When machine runtime data is being imported from the Data Acquisition Engine by Prophecy, any sections of downtime covered by this grace period will be reported as runtime and will not require operators to choose a downtime reason.
-
Enabled: This determines whether the Data Acquisition Engine should continue to log runtime data for this machine and Prophecy should continue to import it. If a machine is retired or is going to be offline for an extended period, it is a good idea to uncheck this setting to save system resources. This setting is not available when initially creating a new machine. After the machine is created in Prophecy, the data for determining when the machine is up/down has to be configured in the Data Acquisition Engine (contact the Prophecy Consulting Group for assistance with that step if needed). Once that is done, the machine can be enabled, and runtime data will start to be collected.
Note that machines cannot be deleted, for historical data reasons.
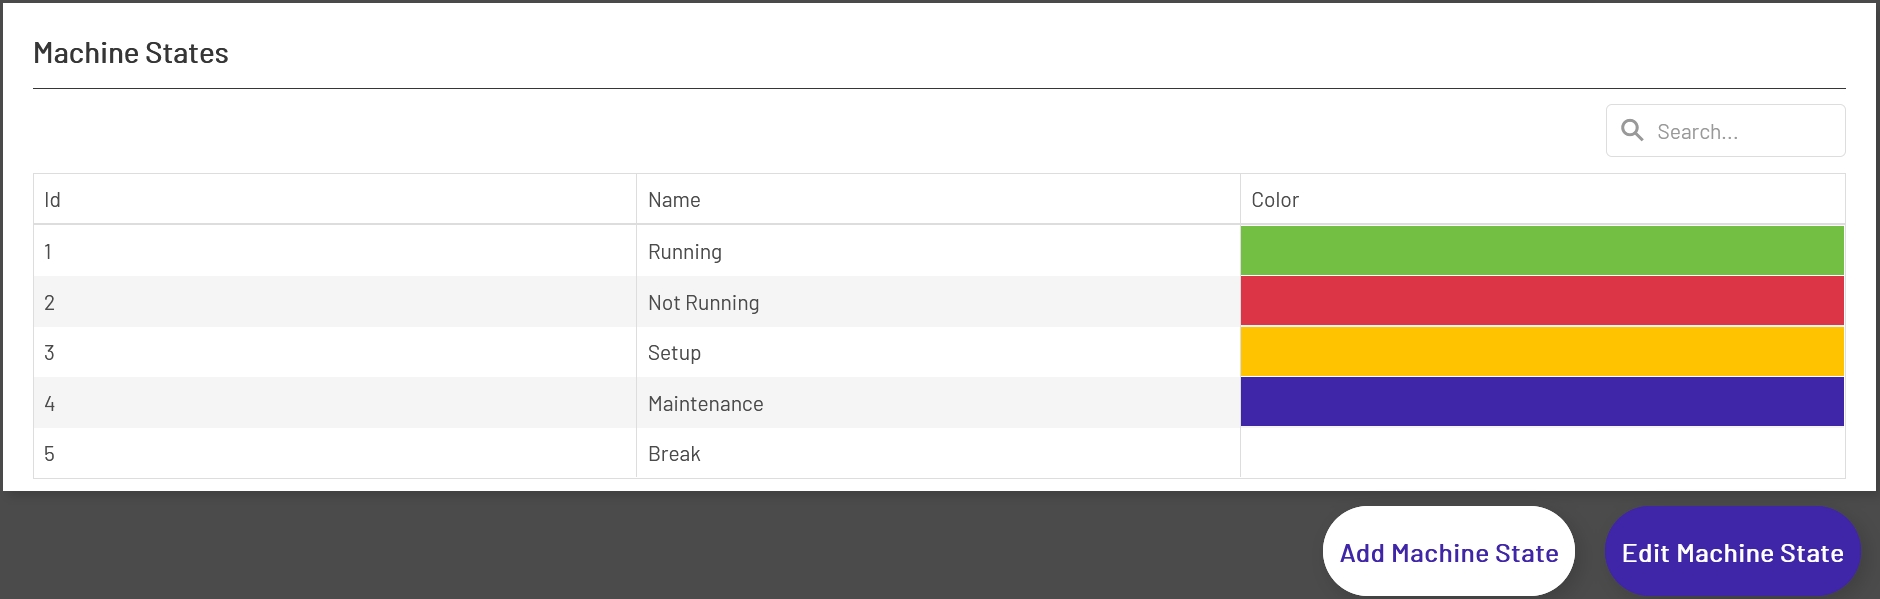
Machine States
These are the reasons that operators will be able to choose from when setting downtime reasons on the timeline. To manage other machine states, use the buttons below the grid:
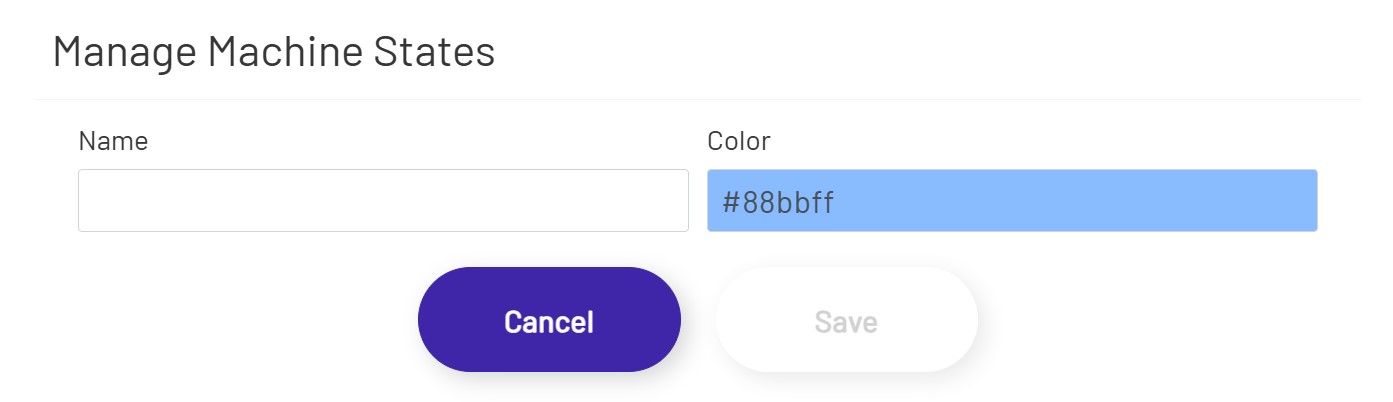
There are only two config options for each machine state.
-
Name: This name will appear in the dropdown the operator chooses from when assigning a downtime reason on the timeline. While this can be changed later for user-added machine states, Prophecy comes pre-loaded with 'Running' and 'Not Running' states, whose names cannot be changed.
-
Color: This is the color that will display in the timeline after an operator assigns this reason to a stretch of downtime.
Note that machine states cannot be deleted, for historical data reasons.
Operator Schedules
Operators can only see machines that they are assigned to on the on the timeline page, and can only view and edit downtime reasons for times they are scheduled on each machine.
To set up what data an operator will have access to, first choose their name from the dropdown at the top of the page (only users in the Admin, Supervisor, and Operator roles will be in that list):
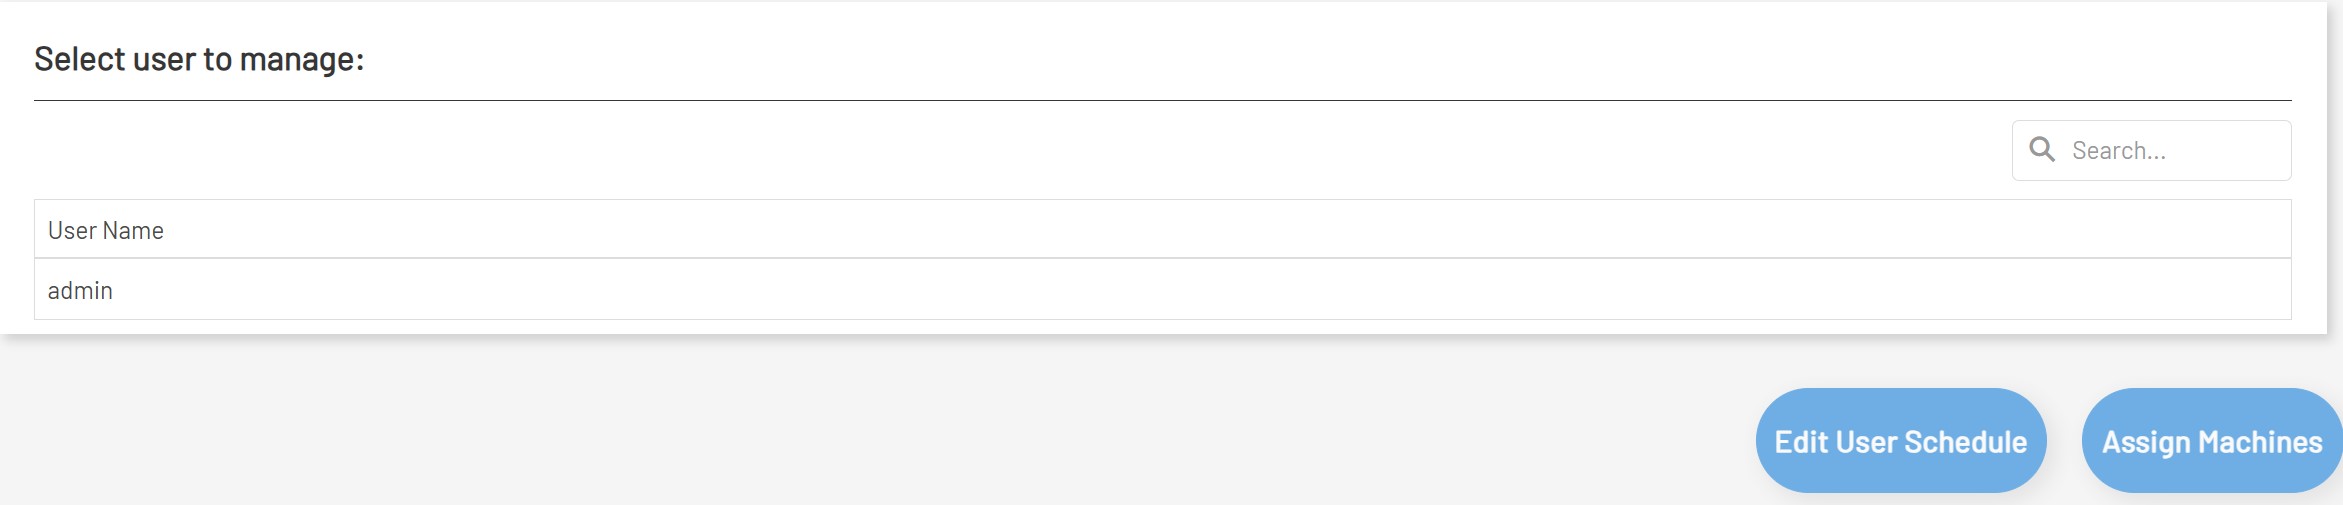
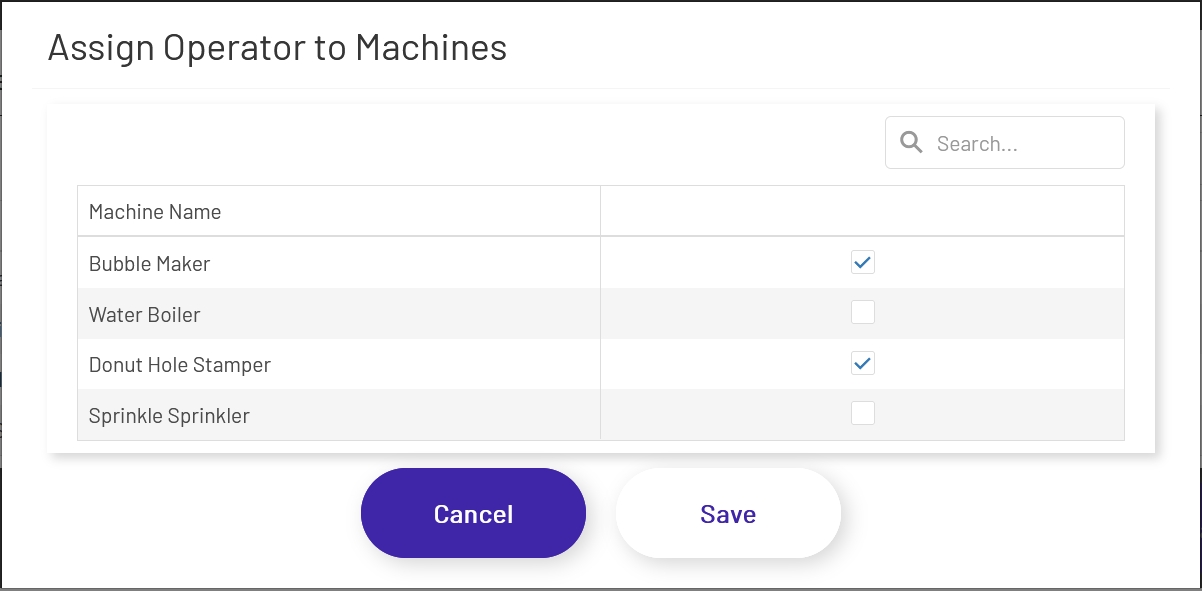
Then click the 'Assign Machines' button and check which machine(s) the operator will be operating and entering downtime reasons for:
Once the operator is assigned to at least one machine, click the 'Edit User Schedule' button. The window that opens will show all of the machines the operator is assigned to in an accordion. For each machine, expand that section of the accordion and enter the times the operator will be operating that machine:
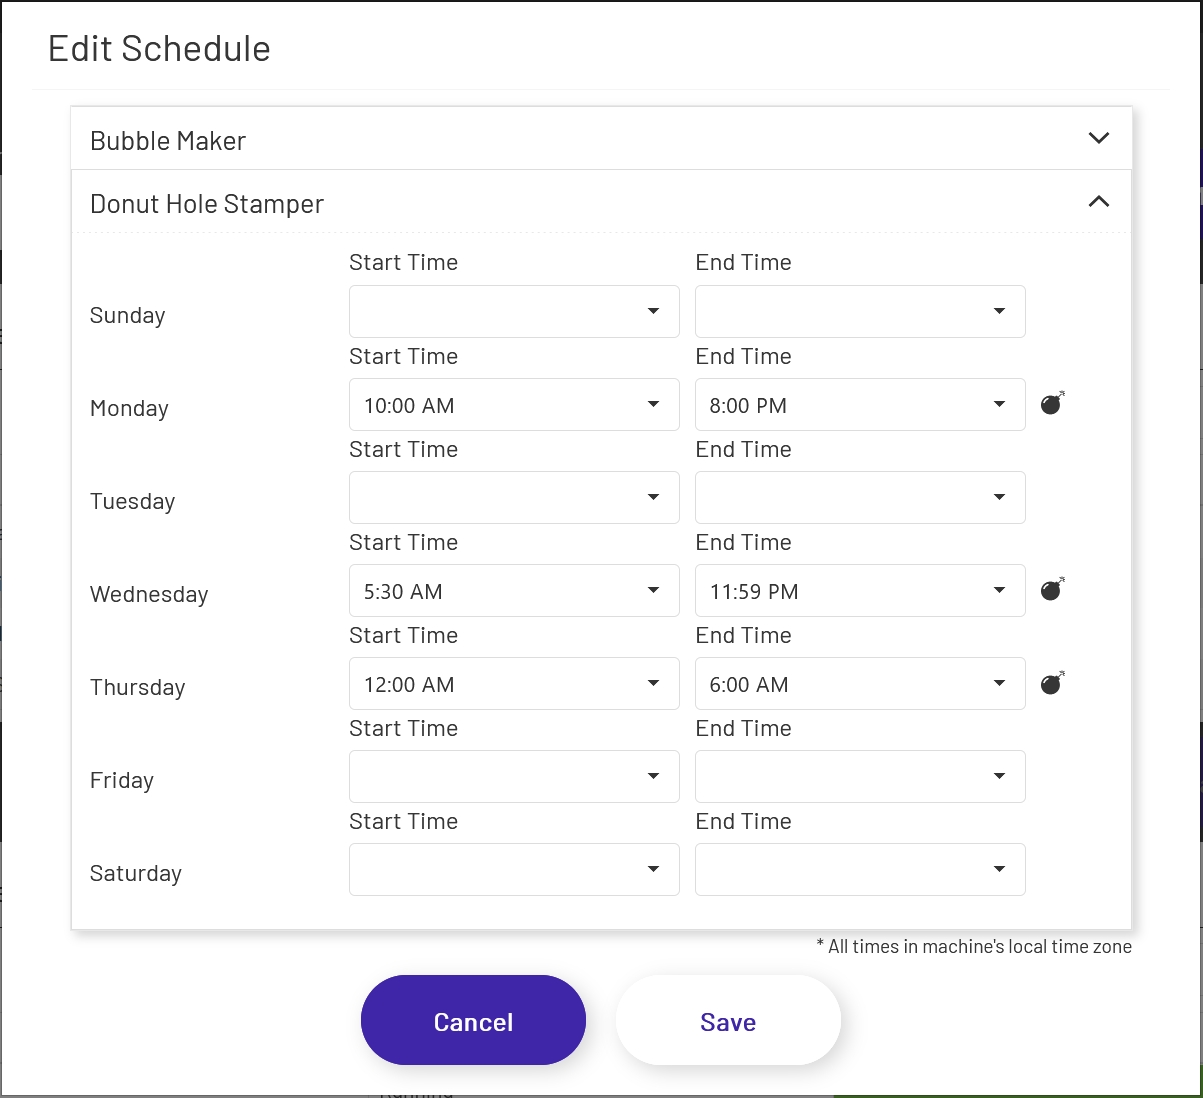
Note that only one scheduled period per day is supported (no split shifts). If an operator's schedule changes, they will not be able to view historical data from their previous schedule in the timeline.