Dashboards
The dashboard functionality in Prophecy allows the user to create and view "dashboards" of information - that is, a collection of graphs, gauges, and charts that can display related data on one easy-to-read display. These dashboards can then be viewed by launching Prophecy and navigating to a particular dashboard via Enterprise Explorer or by pressing the Dashboards button in main navigation, and selecting one from the drop-down. A user must belong to the Dashboards or Admin roles to work with, or even view, dashboards.
Dashboards default to a read-only mode that displays data and updates automatically. Use the full-screen button in the top navigation bar to display, or edit, utilizing all of your display real-estate. This is an excellent way to display the dashboard on an overhead screen or projector to deliver key analytics to a group of workers.
Combine With Aggregation Output
One very powerful use of dashboards is to create dashboards that are based on the Prophecy Aggregation engine. While this isn't a mandatory step by any means, the aggregations that are set up to "fire" when certain tag conditions change brings together a data collection engine with a great means to display such data.
Data Sources
Dashboards retrieve data by using one or more Data Sources. Every Data Source connects to a single external SQL database, using the connection details provided in a SQL Connection. The ProphecyAggregation Data Source is automatically added and cannot be changed by the user.
Any number of distinct queries can be made directly in the Dashboard Designer, so new SQL Connections need to be made only when a different SQL database or server contains the desired data.
Basic Navigation
In addition to application-wide navigation, the below describes how to get around in dashboards.
When a user first navigates to a dashboard, it will appear in a "read-only" mode (active rendering of data). The dashboard will update automatically when new data is inserted into its data source:
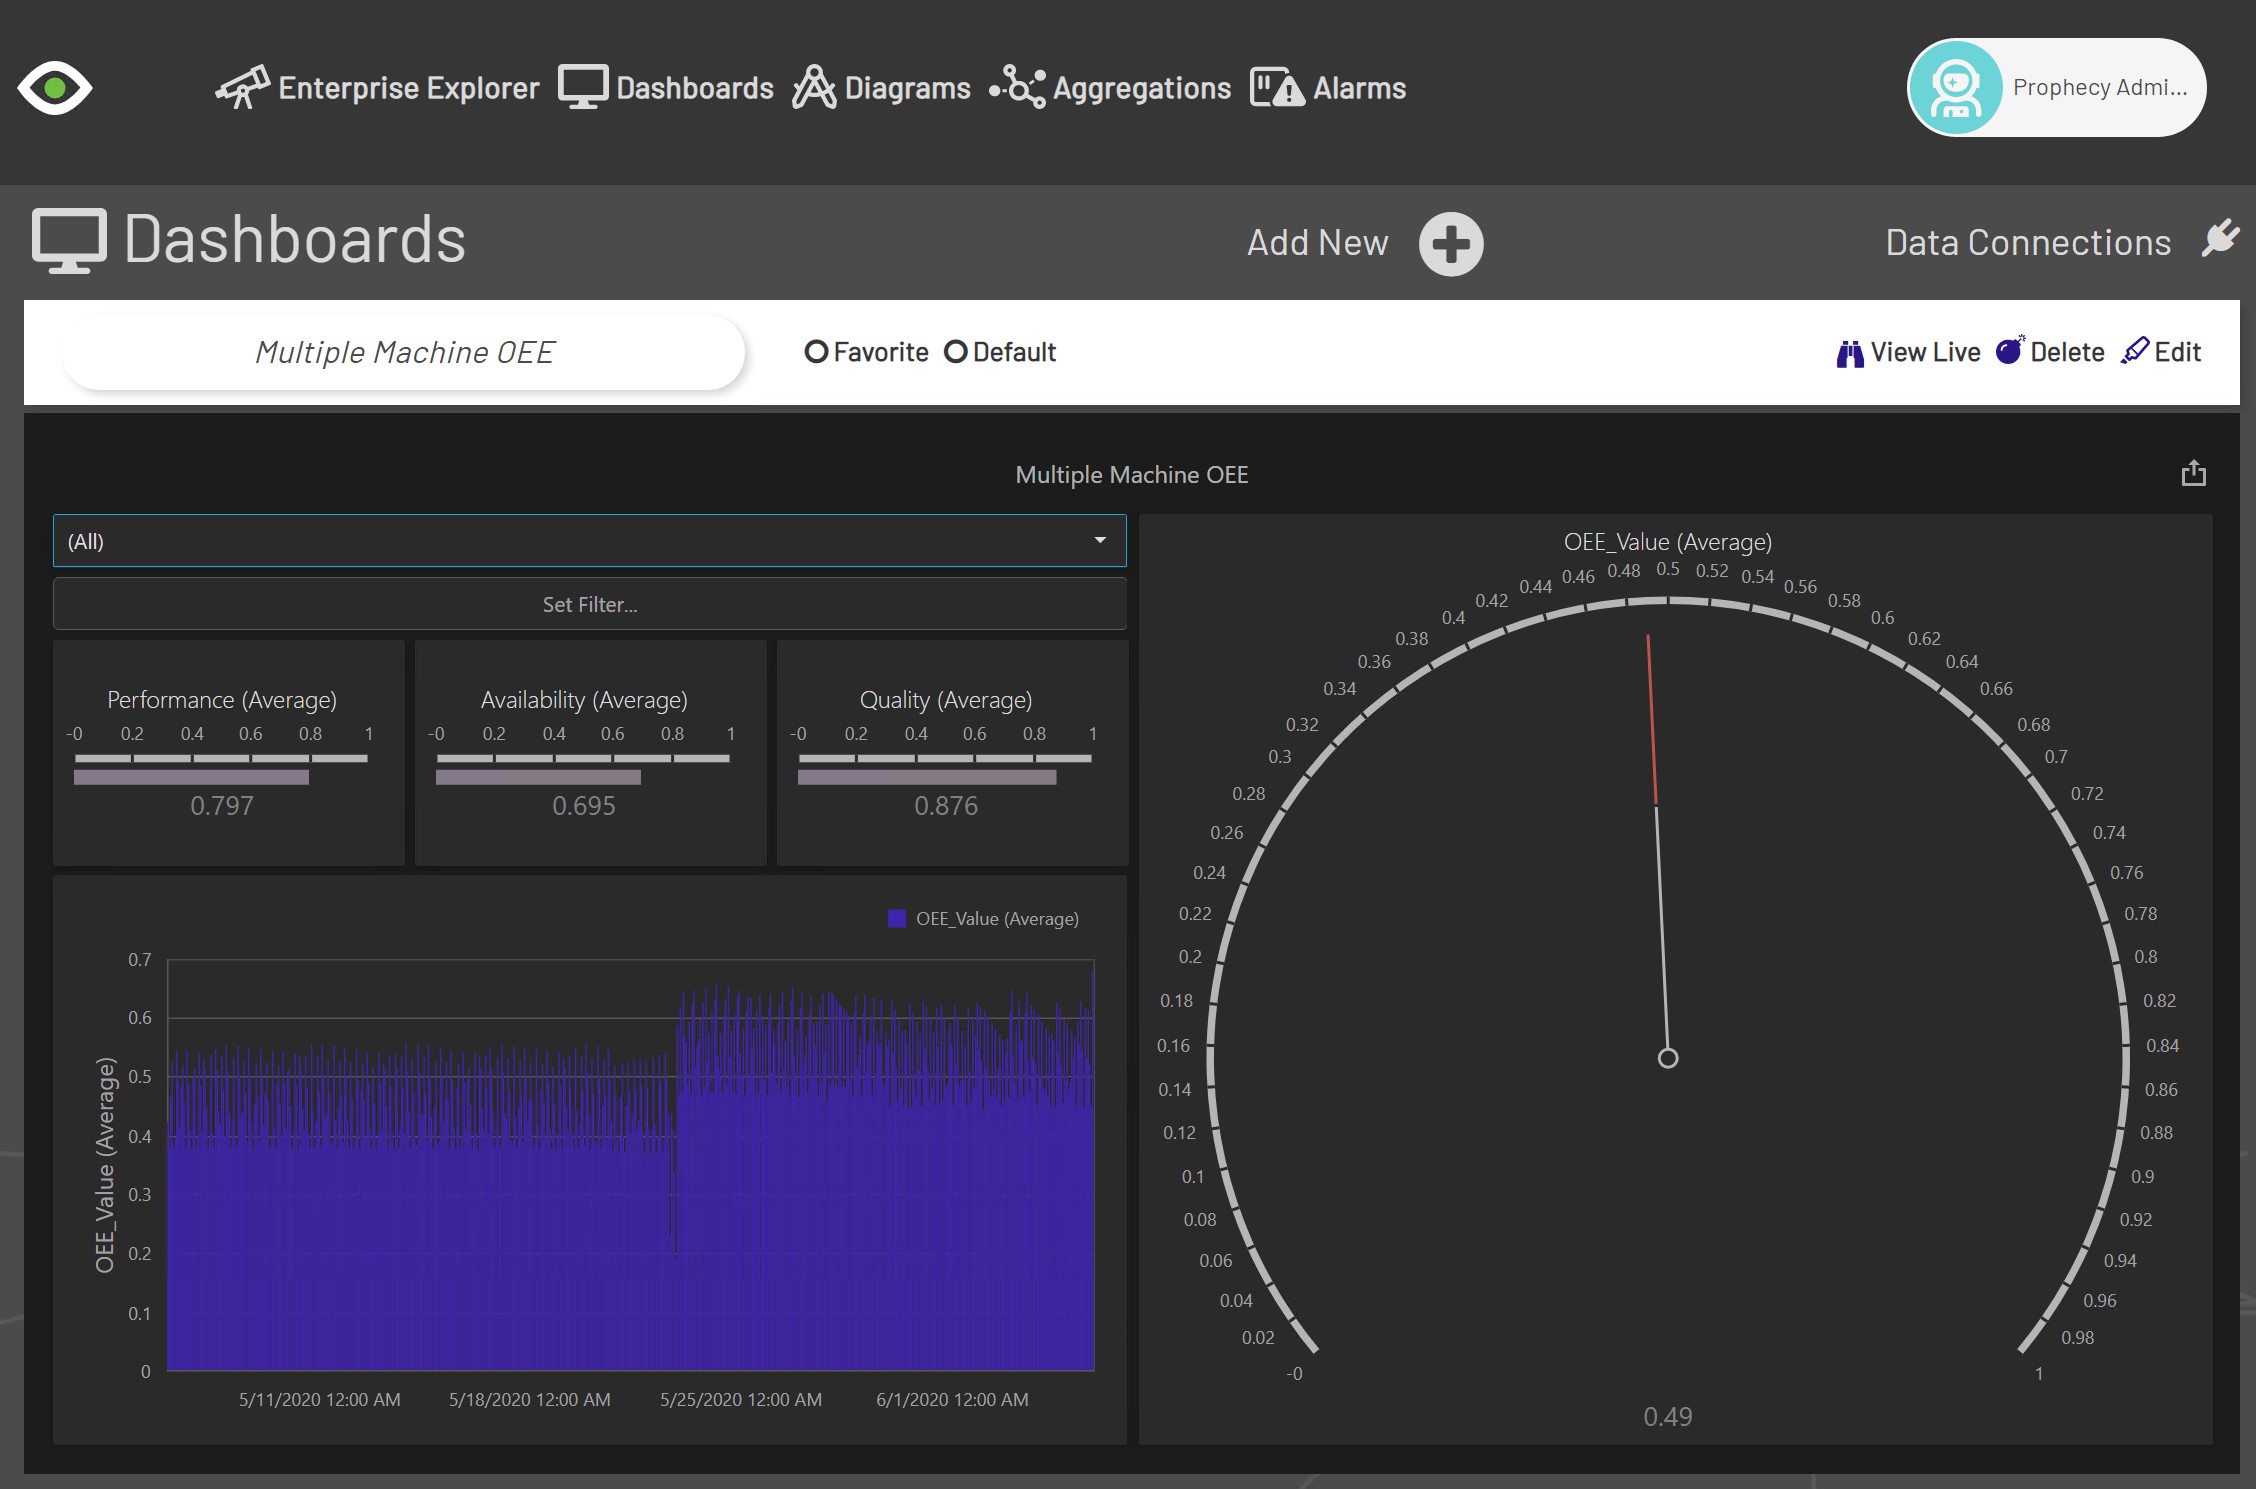
In this screen-shot, the "Multiple Machine OEE" dashboard is displayed, because it was selected from the drop-down. When the full-screen menu item (in the User Menu) is pressed, there is much more real-estate to work with:
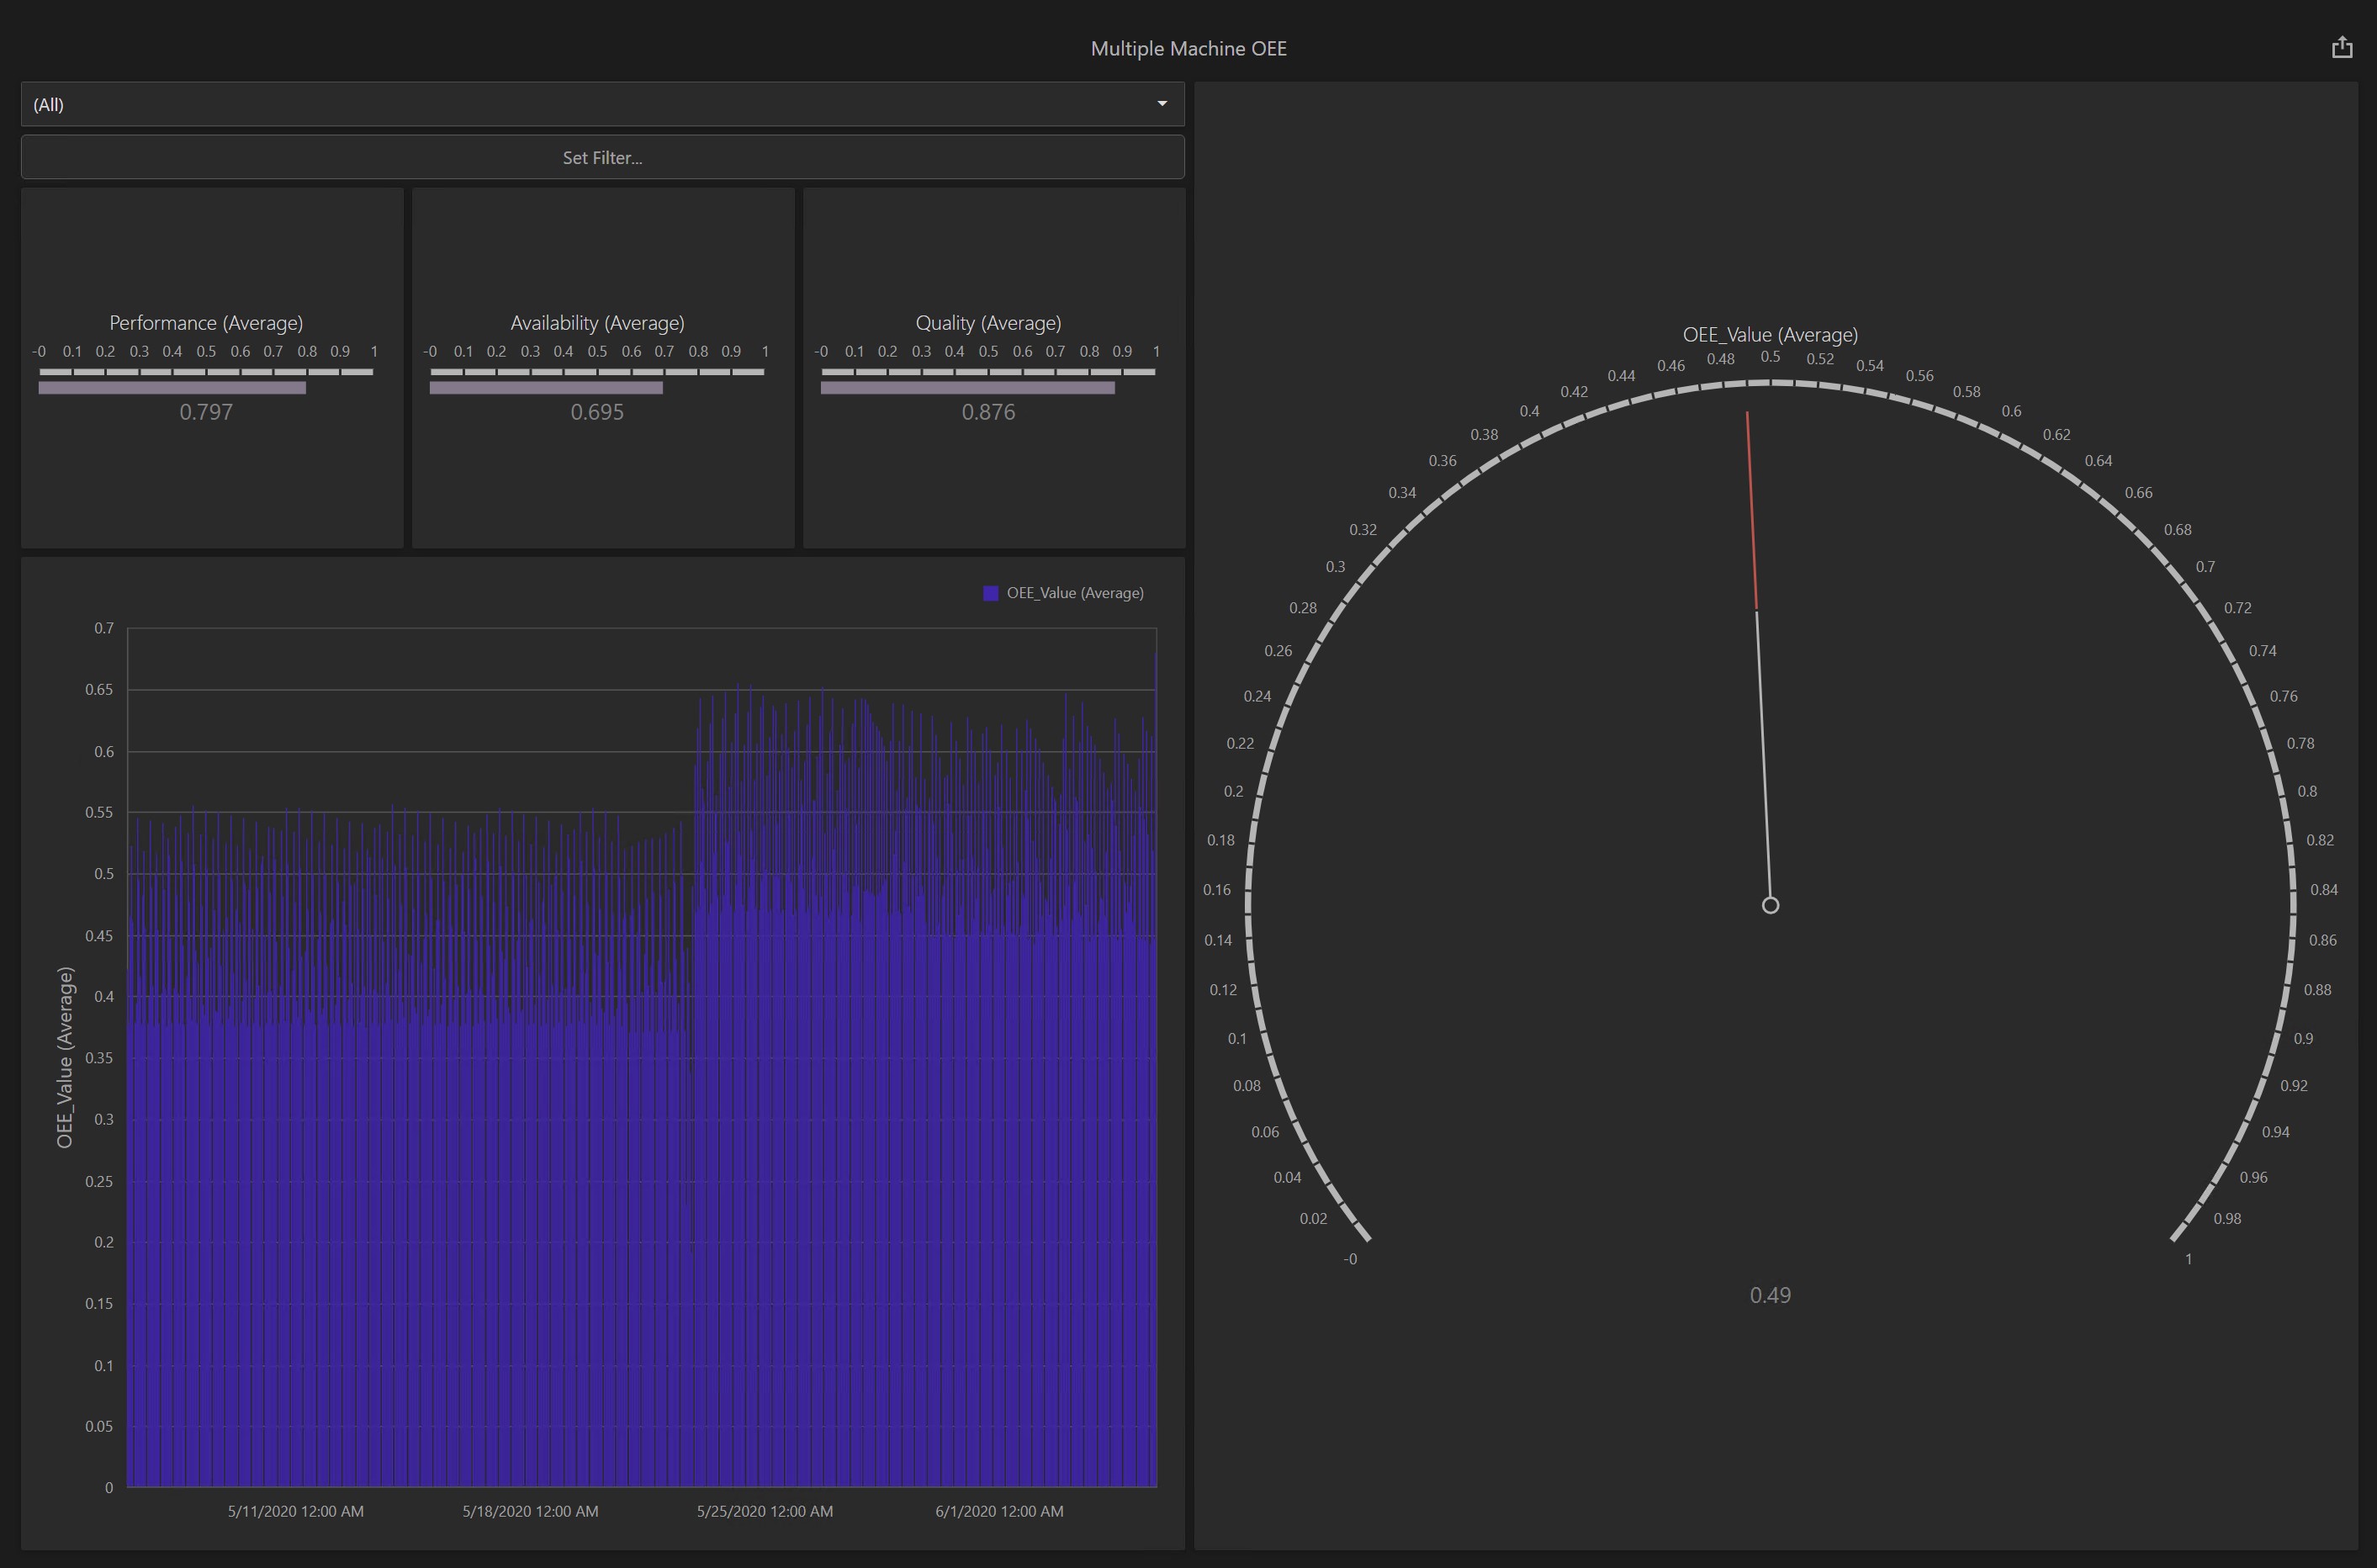
Fortunately, you can do the same in Edit mode, where you design new or edit existing diagrams.
The top bar contains buttons for Add New (Create a new dashboard), Edit (edit an existing dashboard, Delete (delete an existing dashboard), as well as Default and Favorite checkboxes. Finally, View Live will open a new browser tab to display the dashboard selected in a read-only mode, which is very useful for displaying the dashboard on overhead or "touchless" displays.
Permissions Required
First, understand how roles and permissions work in general using the Enterprise Explorer.
Dashboards follow suit. The Dashboards role is required to do anything with dashboards, including view them. The View permission is needed to view the dashboard, Create is required to make a new one, and Edit is required to make changes to an existing dashboard. Of course, if the user is a member of the Admin role, then they will automatically have all of these permissions.
Dashboard Refresh Interval
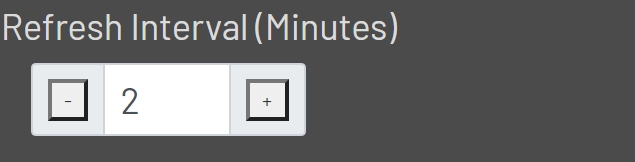
Each dashboard contains a refresh interval. The refresh interval is used to update the dashboard with any new data that may have been added during the interval period. By default the refresh interval is set to 5 minutes when the dashboard is initially created. Refresh intervals can only be adjusted while viewing the dashboard in Edit mode. The default can be adjusted in 1 minute increments. Refresh intervals can only be set between 1 and 2880 minutes. Only whole minute incremental values are allowed.
While viewing a dashboard in Edit mode, the refresh interval control will be located in the bottom left corner below the dashboard.
Modes
New
To go into New mode, click the Add New button above the list of existing dashboards, or select Add Entity from the Enterprise Explorer tree under the Data Automation -> Dashboards group.
When you create a new dashboard, Prophecy will first prompt you for a name and description. Once you click save, a blank dashboard will be created and you will automatically be put into Designer Mode.
Note: make sure you update the dashboard name and description via the dashboard designer to match the name and description given after the initial save, if and when they are updated.
Viewer
To view a dashboard, select it from the dropdown in the Dashboards section, or select it in the Enterprise Explorer tree (or a Link to it).
See an explanation of individual screen elements while in Viewer Mode.
Designer
To get to Edit Mode, choose the Dashboard you want to edit from the dropdown list, then click the Edit button at the bottom of the screen.
See an explanation of individual screen elements while in Designer Mode.