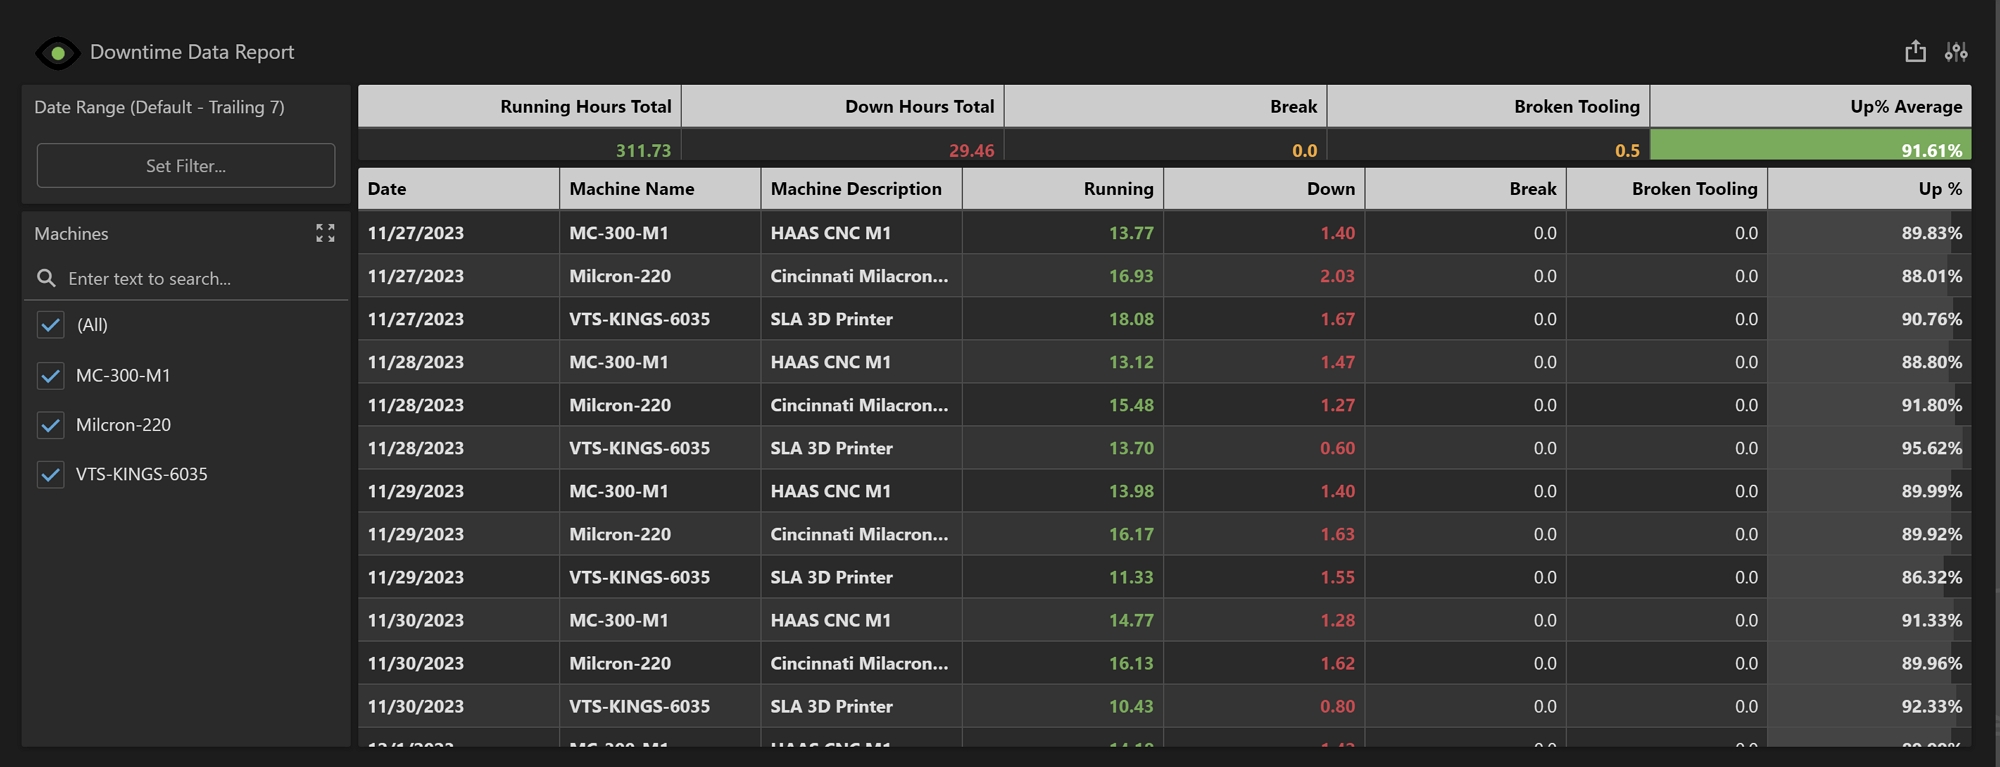
The Downtime Data Report displays data related to Downtime over the last 7 days. This date range is the previous 6 days plus the current day. This report can be filtered by date and by machine. By default, this only shows the Running Hours and Down Hours. Specific reasons can be added to this report once they have been configured in the Downtime feature in Prophecy.
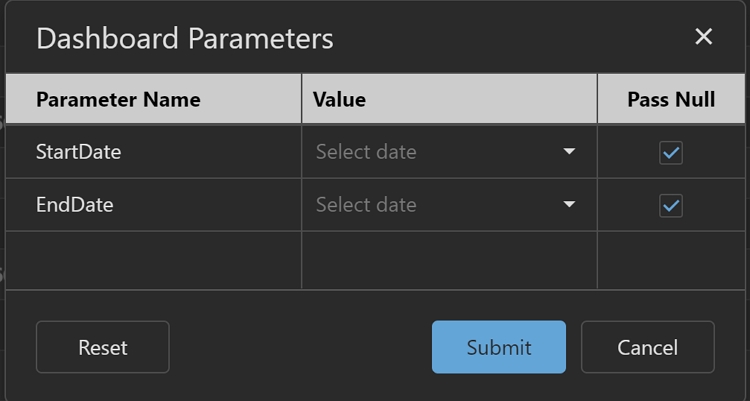
The Downtime Data Report has the following global filter parameters that can be set to open or close the range beyond what is initially set at load time.
-
Start Date: The start date for the date range. Default is the previous 6 days.
-
End Date: The end date for the date range. Default is the current day.
Note: Downtime must be fully configured in Prophecy before this report will display any data.
Summary Grid
The Summary Grid displays totals based on the information in the Main Grid and will automatically update based on filter criteria.
-
Running Hours Total: The sum of all running hours in the Main Grid.
-
Down Hours Total: The sum of all downtime hours in the Main Grid.
-
Up% Average: The average of the Up% from the Main Grid. This contains a conditional format. If the Up% is greater than 70%, the background will display in green and if less than 70%, this will display in red. Reference Conditional Formatting to adjust or change these values.
Main Grid
The Main Grid displays a summary of all Downtime events by day and machine. All Downtime and Uptime are aggregated per day.
-
Date: The date the data is aggregated for.
-
Machine Name: The name of the machine
-
Machine Description: The description of the machine.
-
Running: Total hours the machine was running for the day.
-
Down: Total hours the machine was down for the day.
-
Up %: The uptime divided by the downtime.
Downtime Report
Global Parameters