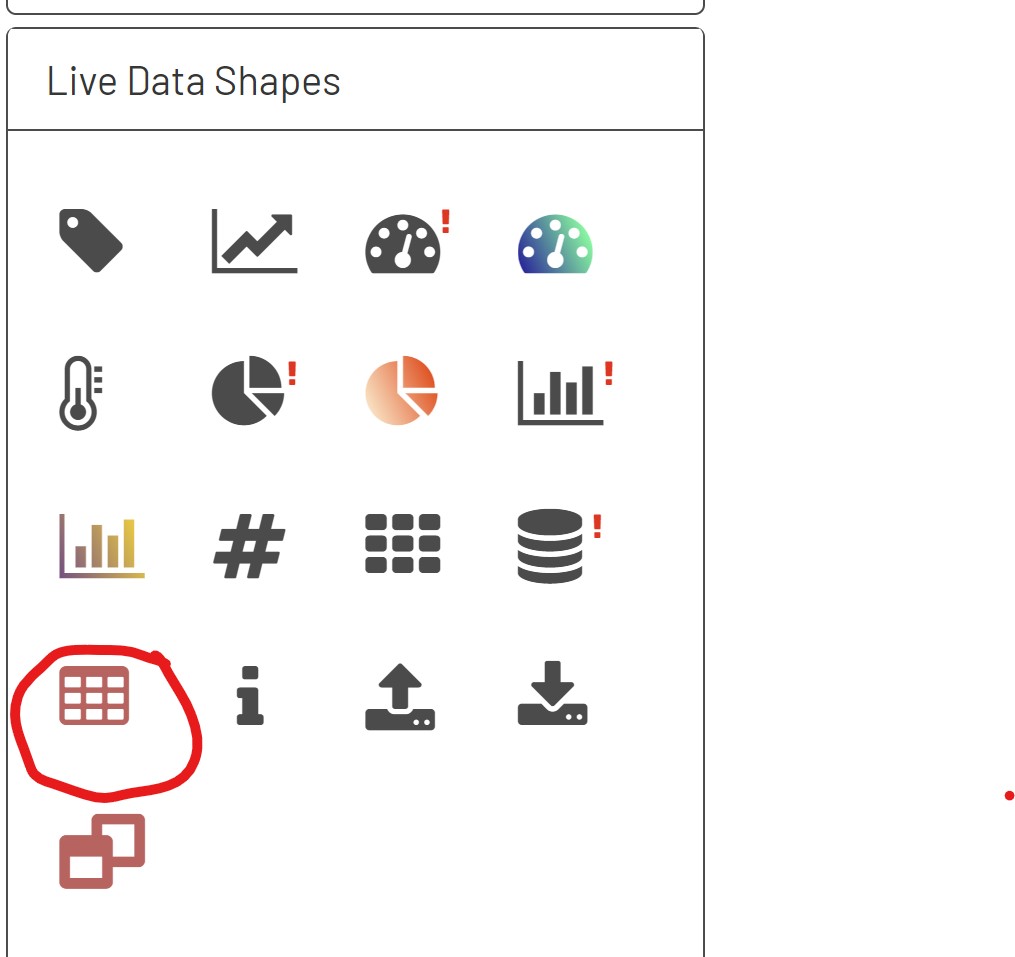
In order to consume complex data from a db tag in a diagram, first drag a grid on to to the screen by selecting it from the live data shapes section.
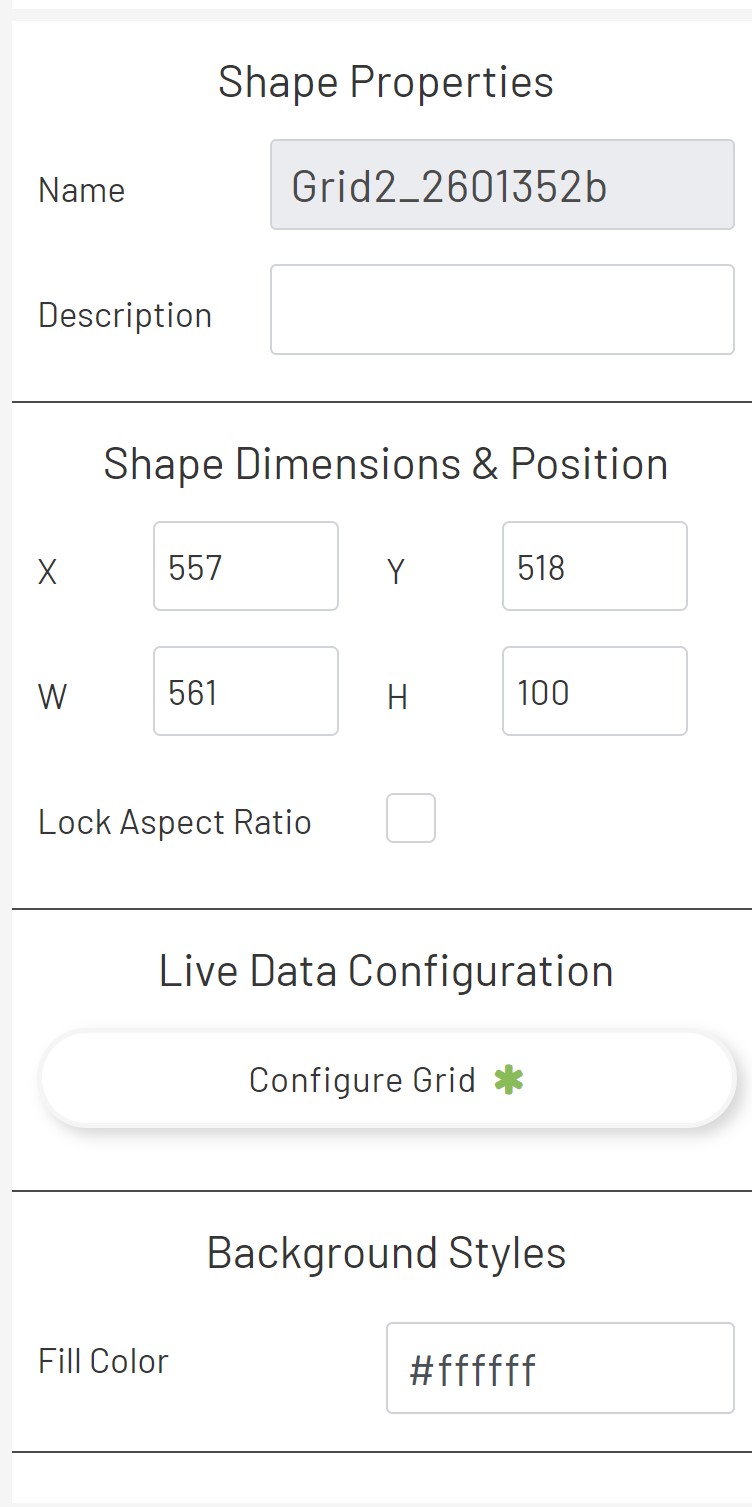
Once the grid is selected, drag it into the diagram. Select the grid and click on the Configure Grid button in the Live Data Configuration of the shape properties.
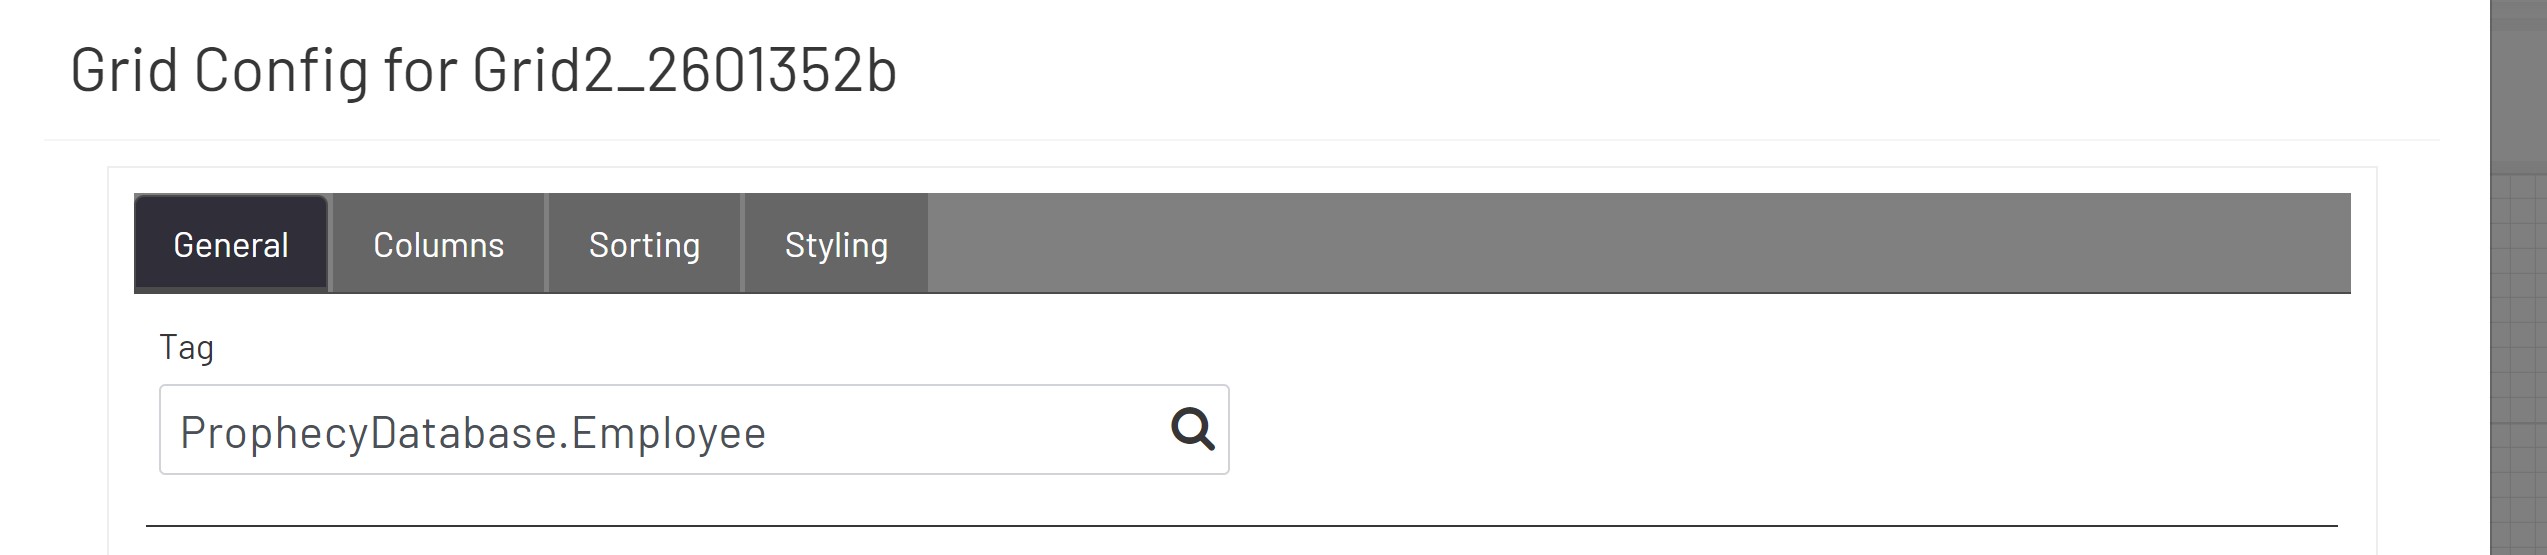
Once in the configure grid editor ensure that you are on the general tab. You should see a lookup input for Tag. Select the DB Tag that you created in the previous steps.
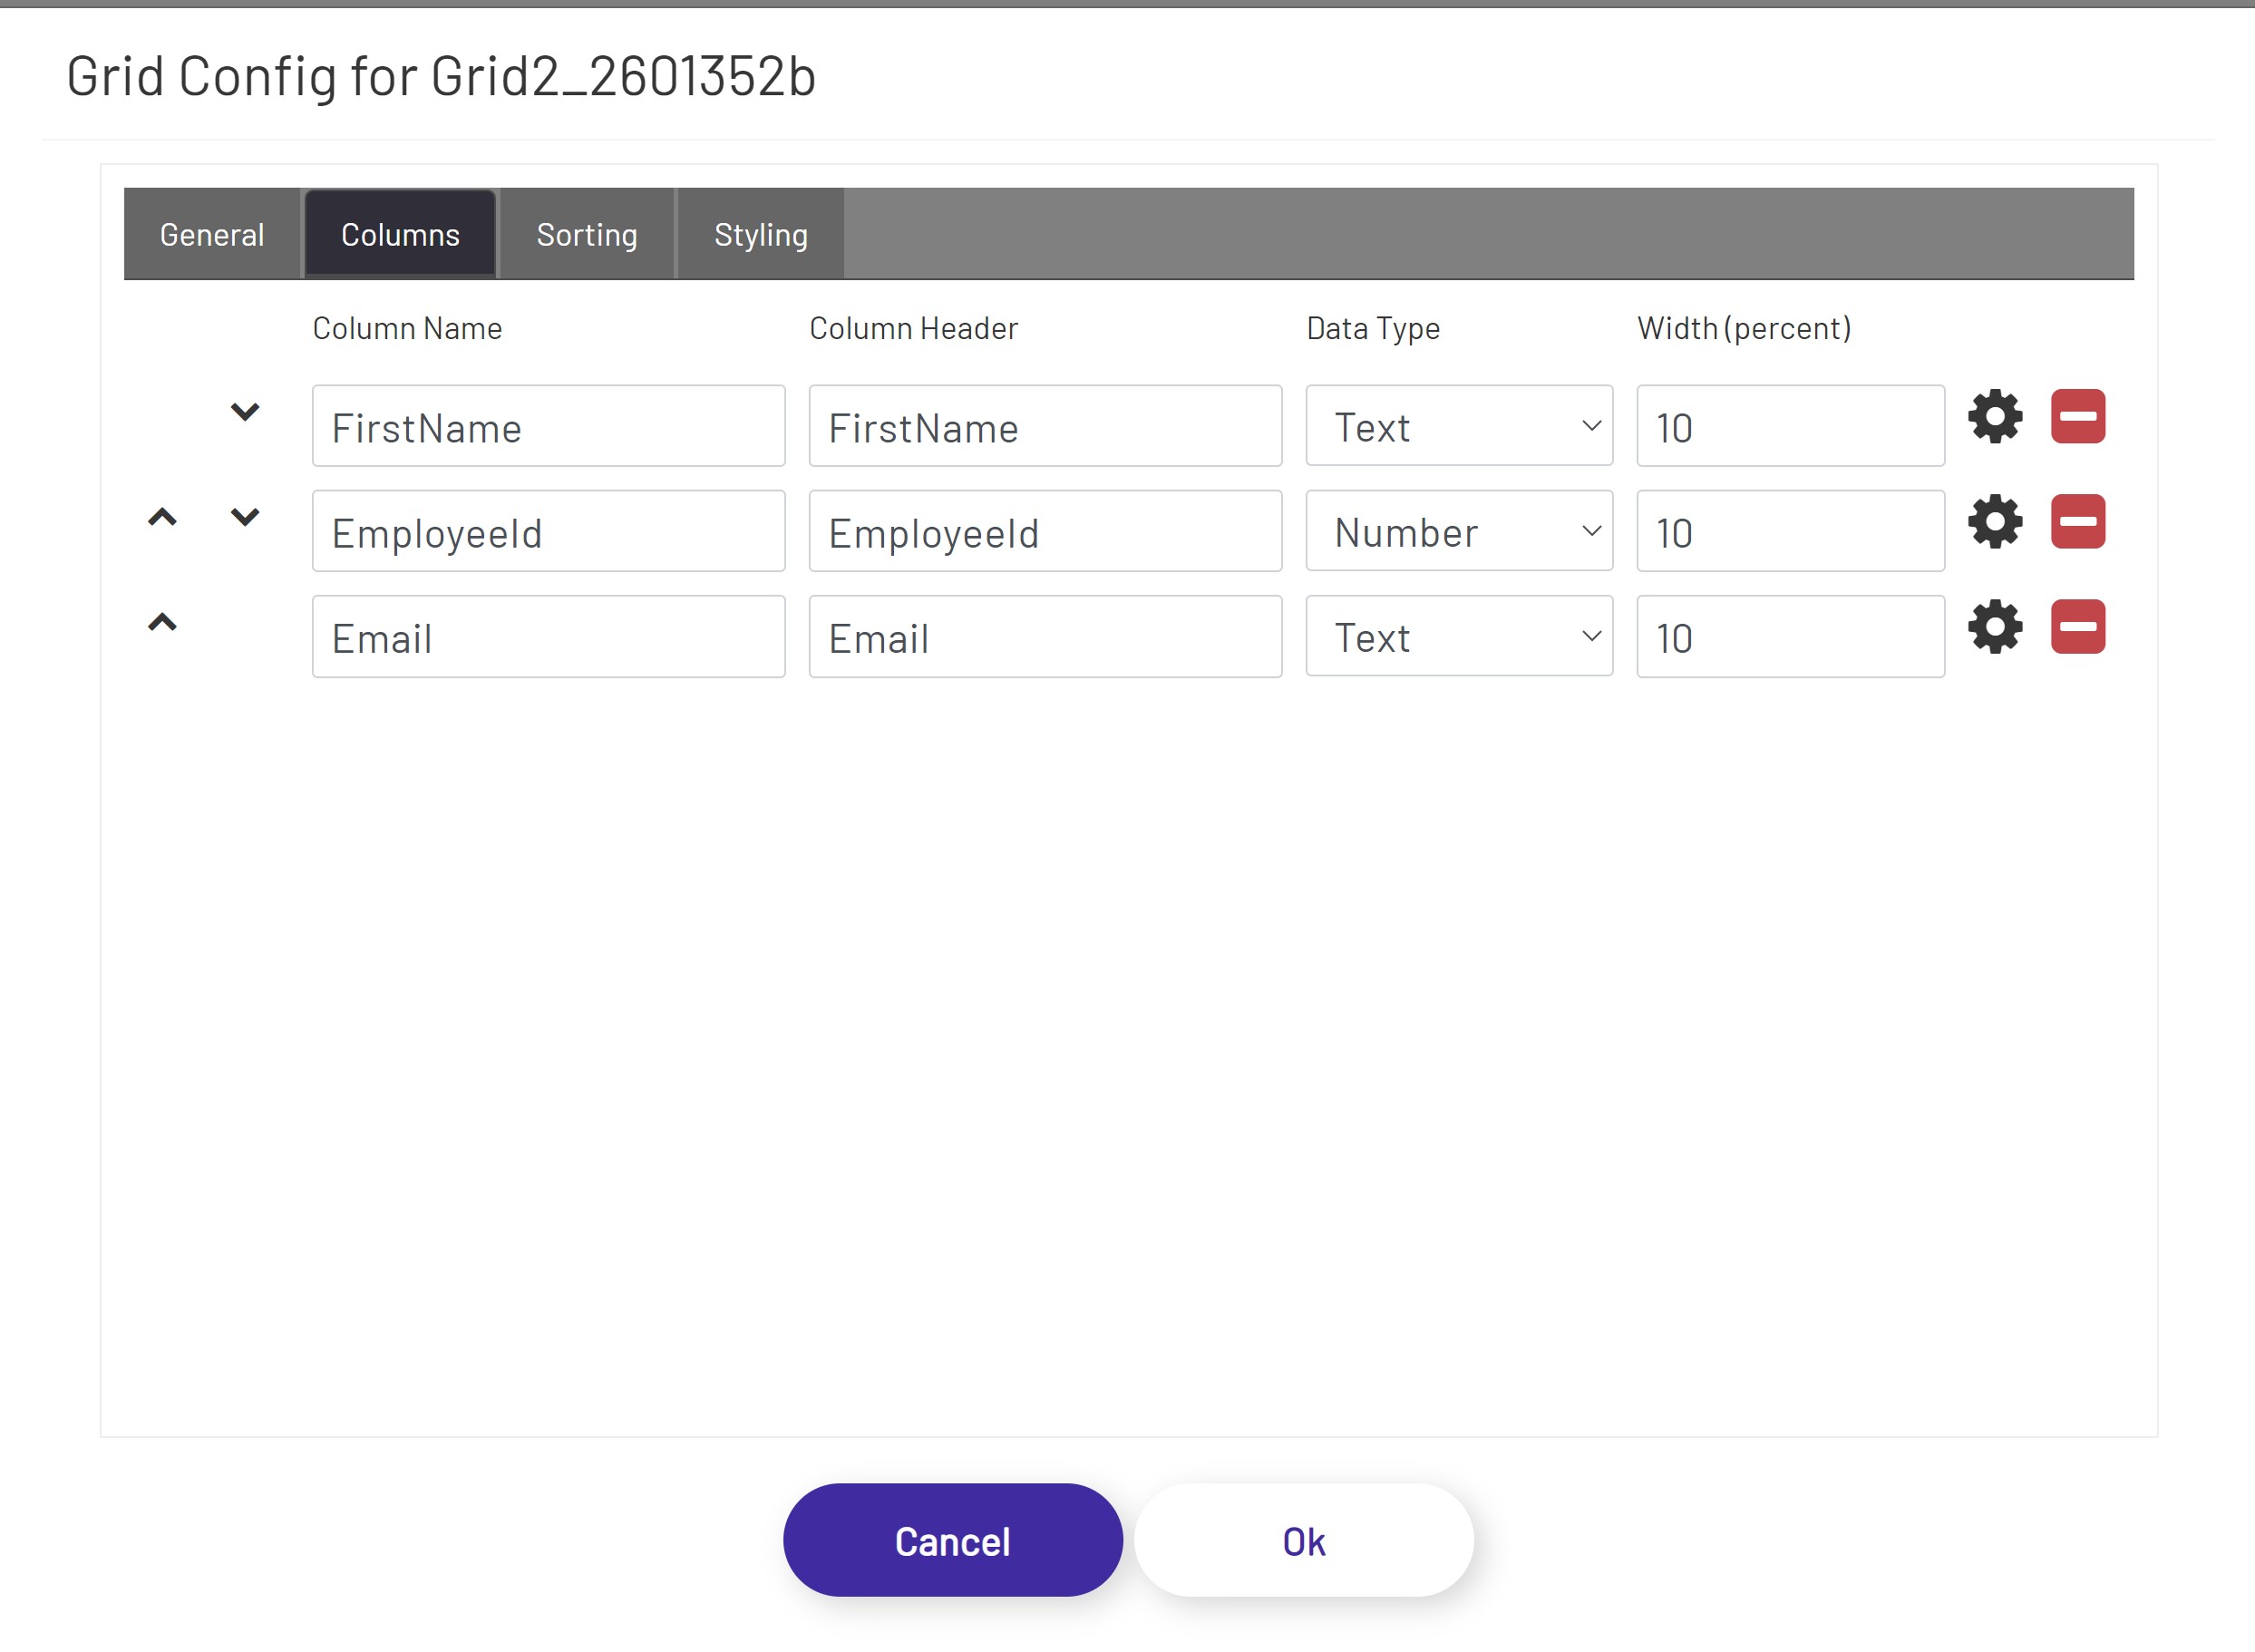
Once the DB tag is selected, you should see the columns tab populate with the columns we defined when creating the data type.
Now, we can view this diagram live and we should see the data from our DB tag being streamed to this grid. The data being streamed here can be edited and it should be live data, meaning that it will update at the frequency we specified in tag manager.