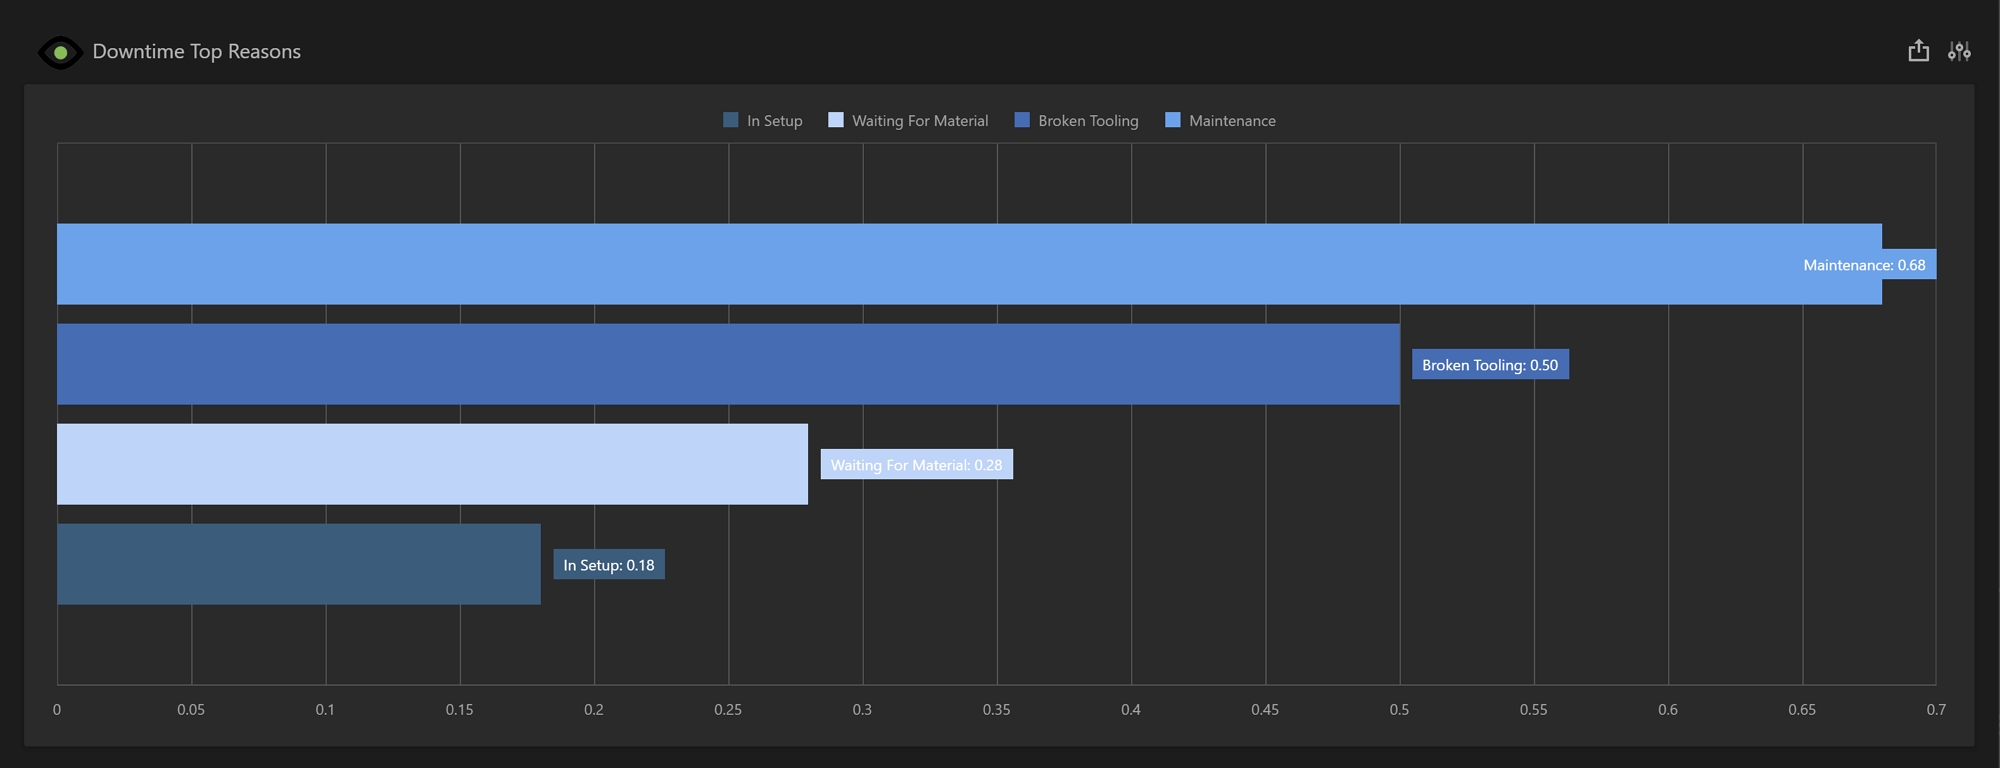
The Downtime Top Reasons dashboard displays a bar chart showing the top reasons contributing to downtime over a period. This dashboard defaults to a date range of 7 days and the top 5 contributing reasons. The default date range is the previous 6 days plus the current day. The time frame and machine count can be adjusted by following the steps outlined here.
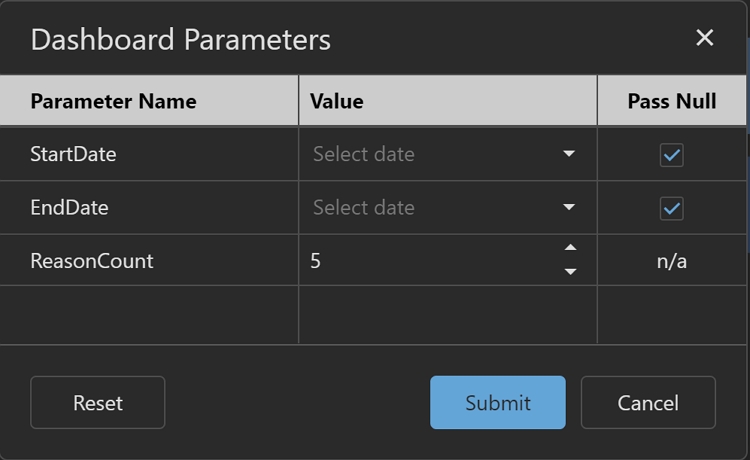
The Downtime Top Reasons dashboard has the following global filter parameters that can be set to open or close the range beyond what is initially set at load time.
-
Start Date: The start date for the date range. Default is the previous 6 days.
-
End Date: The end date for the date range. Default is the current day.
-
Reason Count: This is the count for the top downtime reasons to display in the dashboard. The default is 5.
Note: Downtime must be fully configured in Prophecy before this report will display any data.
Downtime Top Machines
Global Parameters