Prophecy ships with out-of-the-box pre-configured Dashboards and Reports for Downtime data collection, Labor, Scrap, and throughput. Prophecy also has a built-in tool for building custom Dashboards using SQL data sources if the reports and dashboards provided are not enough. If Downtime or Shop Floor Pro are not being utilized, then the Dashboards and Reports in this section will not contain any data.
The Dashboards and Reports below can be accessed using the Dashboard feature in Prophecy. These Dashboards were created with the intent of being displayed in Plant Overview. To use them on their own, a small amount of configuration may need to be done to show the dashboard title and X and Y labels. Each Dashboard and Report has global filters as well as its own set of predefined filters for the data being presented. These settings can be changed in instances where the defaults may not be adequate. Reference the specific Dashboard to see a list of settings the Dashboard or Report offers. Each Dashboard and Report has a configurable refresh interval. The default is 5 minutes, but this can be changed to be as low as 1 minute or adjusted up to refresh as infrequently as needed.
The colors for dashboards and the conditional coloring used for report values can be easily changed if the default colors are not desired. Reference here for information on changing Dashboard colors or Conditional Formatting for information on adjusting conditional formats.
Global Parameters
Each dashboard and report have their own set of global filter parameters that allow the range of data presented to be adjusted on the fly. This filter option should be used when it is desired to adjust the data outside of the pre-set filters for each dashboard and report.
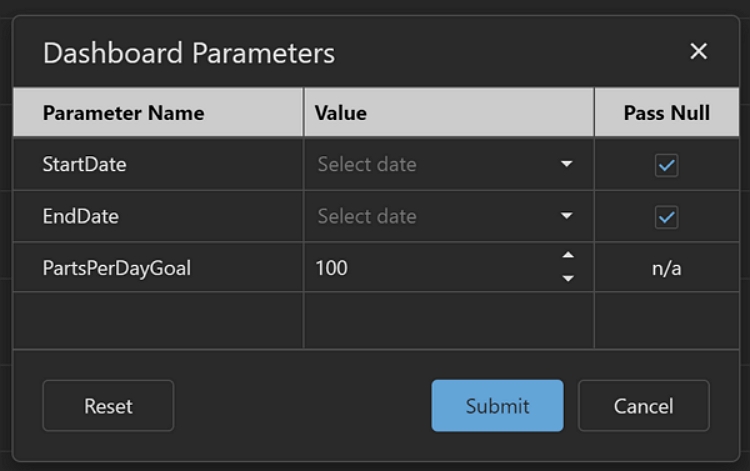
The global filter is located at the top right of each dashboard or report. Every pre-built dashboard and report global filter contains a start and end date parameter. Some dashboards and reports have additional filters that is outlined in the docs for that specific dashboard or report. The dates, by default, are set to null. This cause the dashboard or report to use the predefined date filters that are initially set for the data source. Any other global filter will have a default value set to match the default value of the data source. For these values, a value must be entered when setting the filter parameters.
To view and change the parameters, click the filter button at the top right of the dashboard or report. For date values, both a start and end date can be supplied. Or you can only supply one or the other. When leaving a date blank, it will default to the date value that was initially set for the data source.
Global Filter

Global Parameters
Exporting
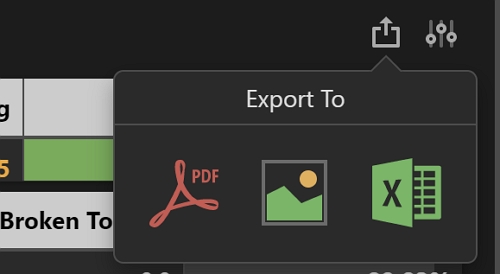
All dashboards and reports can be exported to Excel, PDFs. or images. This is typically most useful with the reports, but there can be use cases where a dashboard needs to be exported and added to an external report.
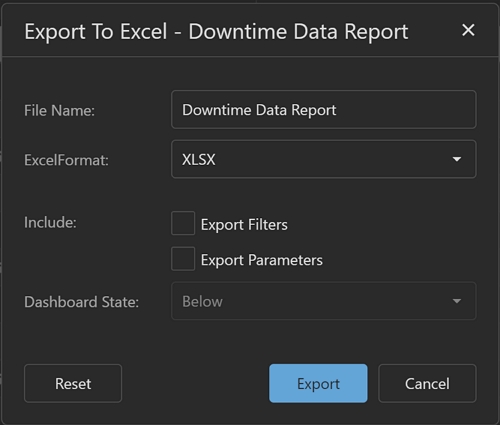
To export, click the Export To button at the Top Right of the dashboard. Then select the export format. After a format has been selected, fill out any other optional parameters for the format chosen. After all selections have been made, then click the export button.
Export

Export To
Additional Settings